Customer Support : 020-61923200, [email protected] | Call and Trade : 020-61923220

ROC ABS
#momentum
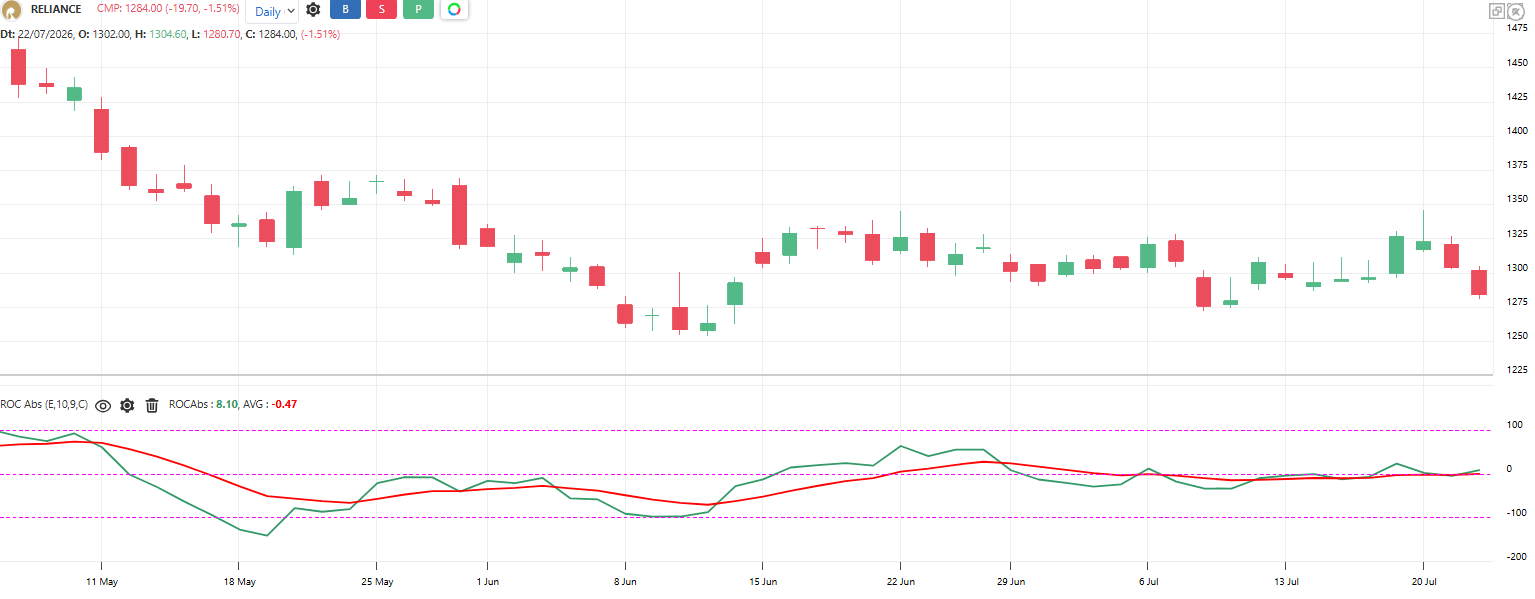
In the ROC ABS indicator, two lines are plotted below the chart.
The green line represents the ROC ABS
The red line represents the average of ROC
ROC indicator represents the rate of change of the stock over a specified period.
The same momentum measure as ROC% but in price points instead of percent: Close today minus Close N bars ago. It tells you how many points the stock or index has moved in N bars. Useful for index and futures traders who think in points, but readings cannot be compared across different stocks.
Default period: 10
Line above zero indicates price higher than N bars ago. Line below zero indicates lower.
Use ROC % instead when comparing different stocks; use this when trading one instrument in points.
Useful readings:
Crosses above zero: Momentum turned positive
Crosses below zero: Momentum turned negative
Bigger positive readings than recent history: Unusually strong upmove
Shrinking positive readings while price rises: Rally covering fewer points per bar, tiring
Useful for setting point-based targets and stops on indices and futures
Same shape as ROC % on a single instrument; only the scale differs
Objective rules:
Bullish: ROC Absolute crosses above zero.
Bearish: ROC Absolute crosses below zero.
Strength rule: Reading above its own 50-bar high, momentum unusually strong, stay with the move
Fatigue rule: Price makes new high but ROC Absolute is below its last peak, tighten stops
Exit: ROC Absolute crosses back below zero
What makes it unique:
It speaks in points, the native language of index and futures traders. Same momentum logic as ROC %, tuned for single-instrument point thinking.
The indicator table value in TradePoint & RZone also provides you with a list of all values of this indicator for any group of stocks. This will allow you to compare the readings of this indicator across different stocks.
This indicator is also available in the System Builder of RZone & TradePoint for all charting methods. Using the system builder, you can develop various strategies based on the different conditions already present in this indicator. Additionally, it can be used with other indicators or price patterns to develop effective trading strategies. For any group of stocks and market segments, you can scan and backtest stocks based on those strategies.
The indicator is applicable to all types of charting. Calculated based on the number of columns on P&F charts, bricks on Renko charts, lines on Line-break charts, candles on Heikin ashi charts, and lines on Kagi charts. While the formula and reading of the indicators remain the same, they become more dynamic on these charts.