Customer Support : 020-61923200, [email protected] | Call and Trade : 020-61923220

GAPO Indicator
#volatility #regime
Inventor: Jayanthi Gopalakrishnan
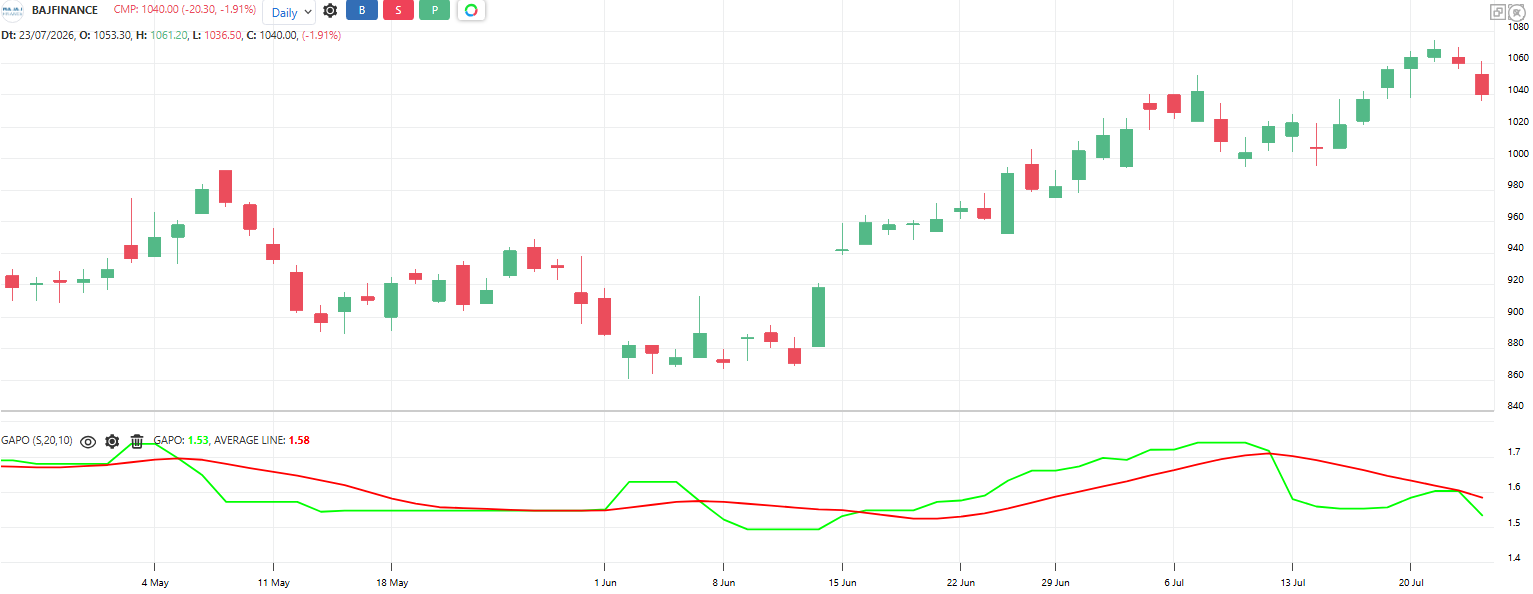
Measures how disorderly the market’s range is. It takes the full high-low range of the last N bars and scales it with logarithms: log(Highest High – Lowest Low) / log(N). An orderly, tightly moving market gives low readings; a wild market spraying price across a wide range gives high readings. Like the Choppiness Index, it describes market character, not direction.
Default period: 20
Rising line indicates the range is spreading out, disorder increasing. Falling line indicates price tightening into an orderly band.
This indicator does not give direction. Use it to judge market character.
Useful readings:
High and rising: Wide wild swings, cut position size, widen stops
Low and falling: Tight orderly market, compression building
Reading at multi-month low: Long tight coil, breakout watch
Jumping up from a low base: The coil broke, a new expansion phase started
High reading flattening: Wild phase maturing, calm may return
Each stock has its own normal level; compare with its own history
Objective rules:
Expansion: GAPO crosses above its 20-period average.
Contraction: GAPO crosses below its 20-period average.
Coil breakout: GAPO at 100-bar low, trade the next price breakout with a trend tool
Risk rule: GAPO in the top zone of its 100-bar readings, halve fresh position size
Pairing rule: Use SuperTrend or Donchian for direction; GAPO only sets the conditions
What makes it unique:
Its logarithmic scaling of the total range measures the disorder of price movement, not just its size. It behaves like a fractal reading of market character.
The indicator table value in TradePoint & RZone also provides you with a list of all values of this indicator for any group of stocks. This will allow you to compare the readings of this indicator across different stocks.
The indicator is applicable to all types of charting. Calculated based on the number of columns on P&F charts, bricks on Renko charts, lines on Line-break charts, candles on Heikin ashi charts, and lines on Kagi charts. While the formula and reading of the indicators remain the same, they become more dynamic on these charts.
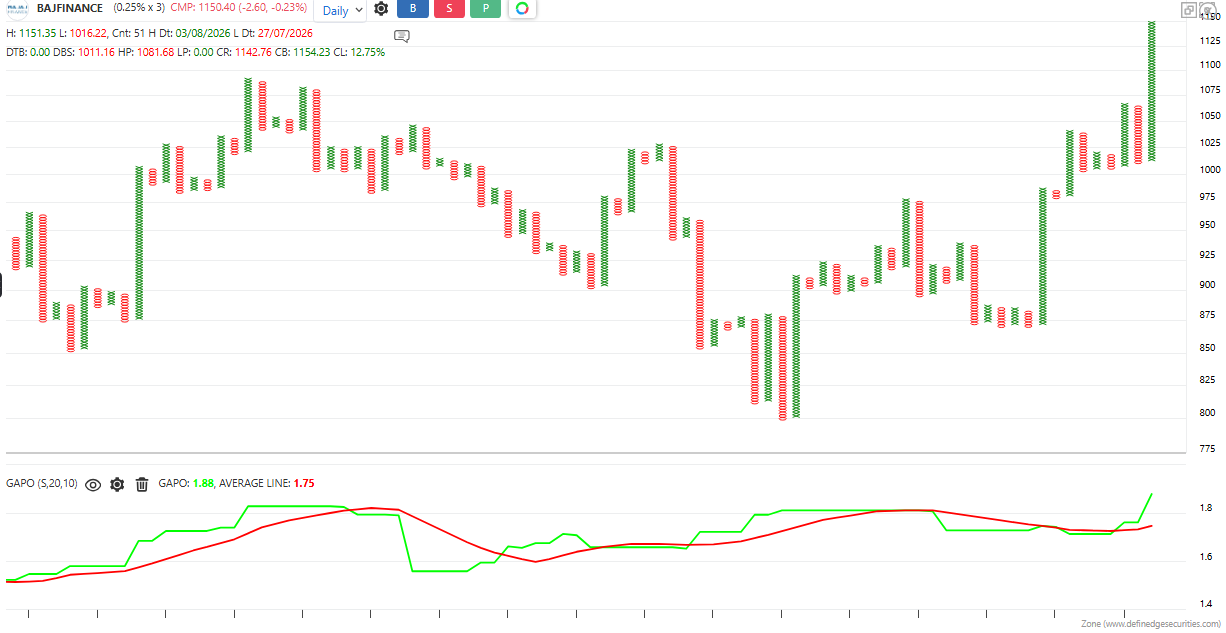
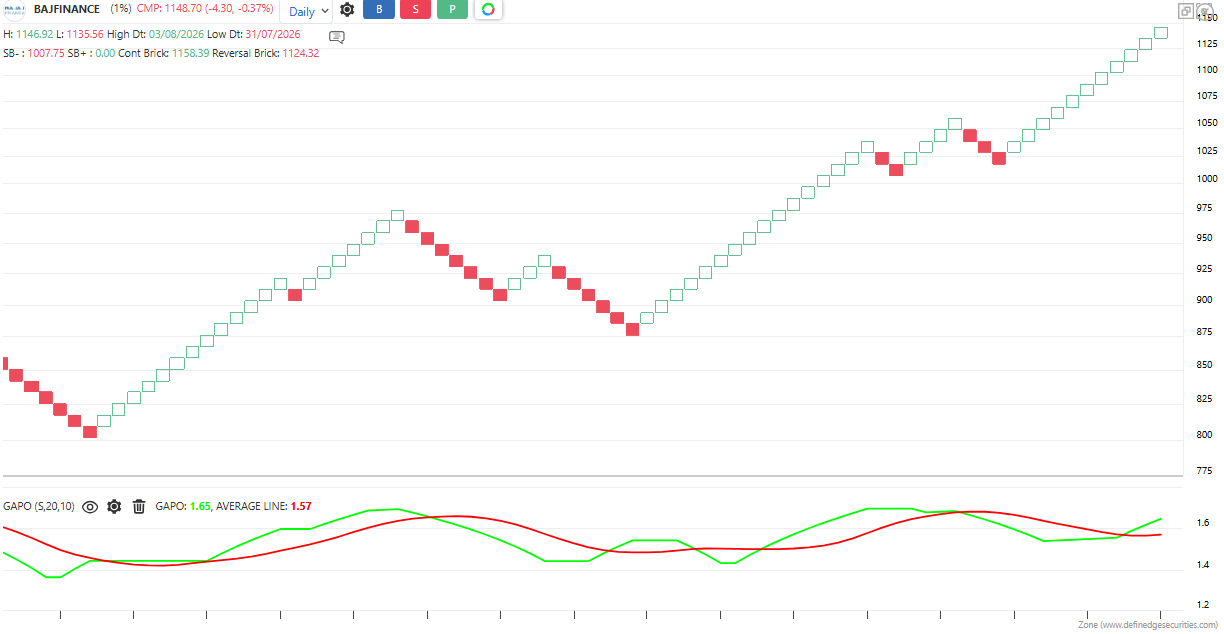
This indicator is also available in the System Builder of RZone & TradePoint for all charting methods. Using the system builder, you can develop various strategies based on the different conditions already present in this indicator. Additionally, it can be used with other indicators or price patterns to develop effective trading strategies. For any group of stocks and market segments, you can scan and backtest stocks based on those strategies.