Customer Support : 020-61923200, [email protected] | Call and Trade : 020-61923220

ROC%
#momentum #oscillator
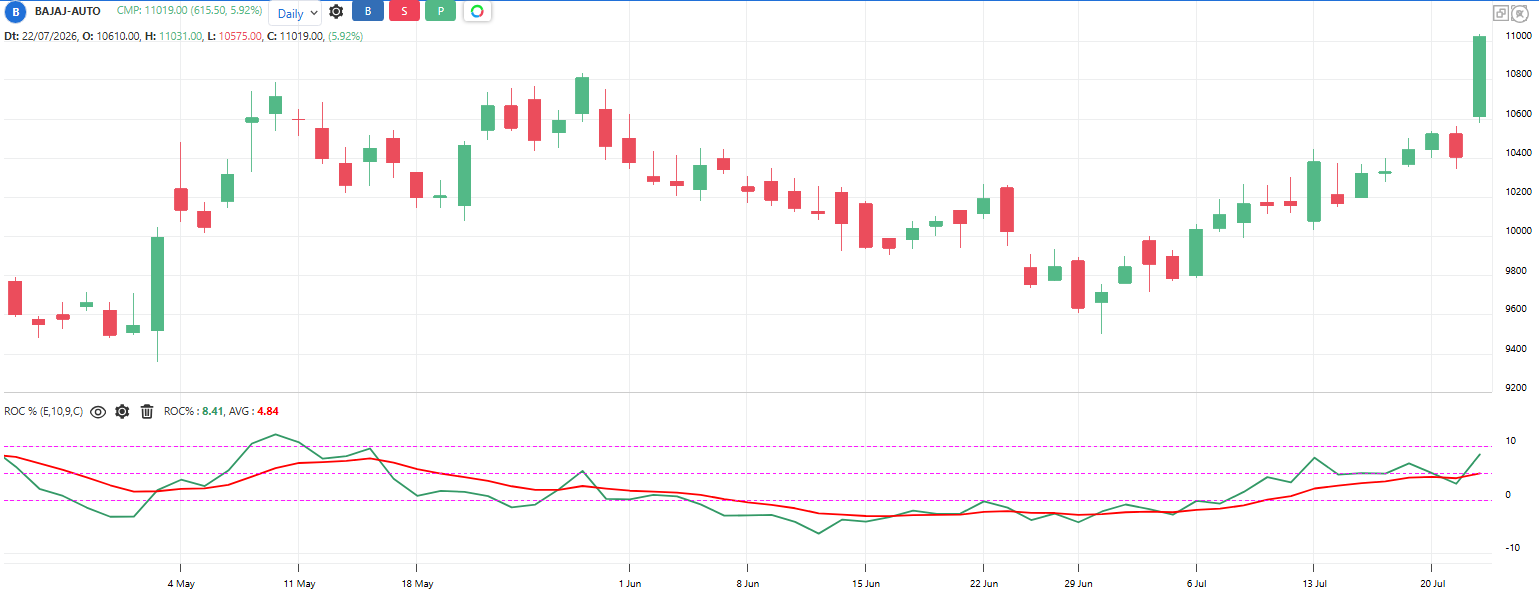
The simplest momentum measure: how much has price changed in the last N bars, in percent. (Close today – Close N bars ago) / Close N bars ago x 100. Positive means price is higher than N bars back, negative means lower. Because it is a percentage, readings compare fairly across stocks.
Default period: 10 (also 20 for swing, 125/250 for positional)
Line above zero indicates price higher than N bars ago, bullish. Line below zero indicates bearish.
Useful readings:
Crosses above zero: Momentum turned positive
Crosses below zero: Momentum turned negative
High positive extreme: Stretched rally, pullback risk
Deep negative extreme: Stretched fall, bounce risk
Holds above zero through dips: Steady uptrend
Price at new high but ROC lower than last peak: Bearish divergence, rally slowing
Used for momentum ranking: sort stocks by 6-month or 12-month ROC to find leaders
Objective rules:
Bullish: ROC % crosses above zero.
Bearish: ROC % crosses below zero.
Momentum ranking rule: Buy the top decile of stocks by 6-month ROC, review monthly
Trend filter: Take longs only when the longer ROC (125-period) is also above zero
Exit: ROC % crosses back below zero
What makes it unique:
It is momentum in its purest form – no smoothing, no weighting, just percentage change. Entire momentum-investing strategies are built on ranking this single number.
The indicator table value in TradePoint & RZone also provides you with a list of all values of this indicator for any group of stocks. This will allow you to compare the readings of this indicator across different stocks.
This indicator is also available in the System Builder of RZone & TradePoint for all charting methods. Using the system builder, you can develop various strategies based on the different conditions already present in this indicator. Additionally, it can be used with other indicators or price patterns to develop effective trading strategies. For any group of stocks and market segments, you can scan and backtest stocks based on those strategies.
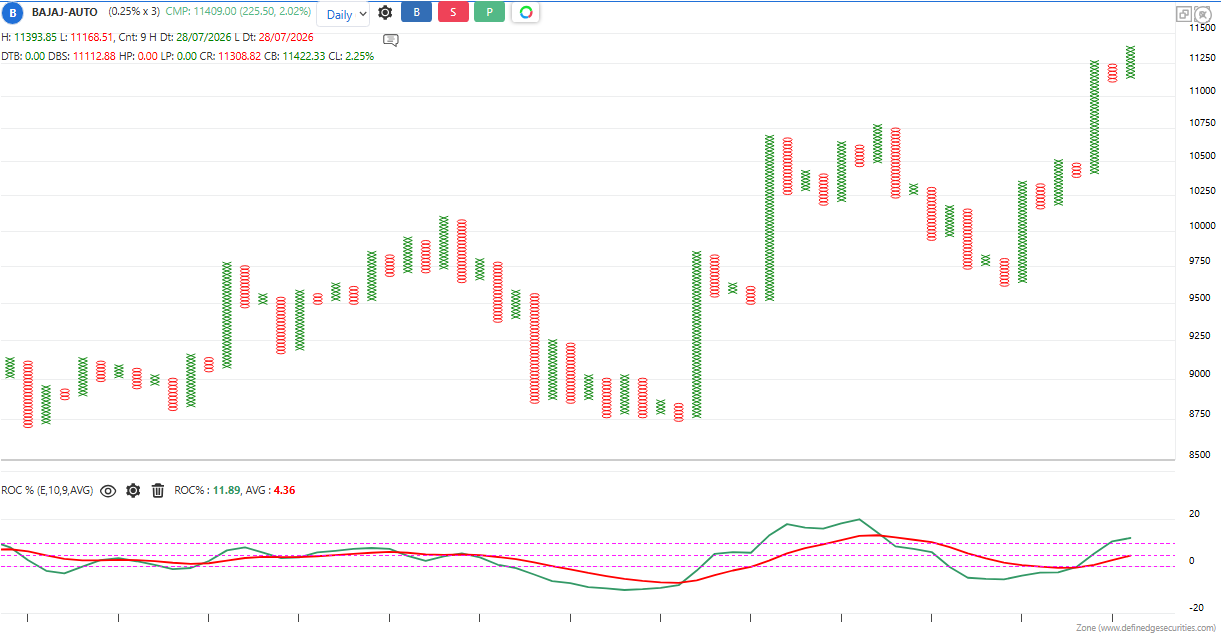
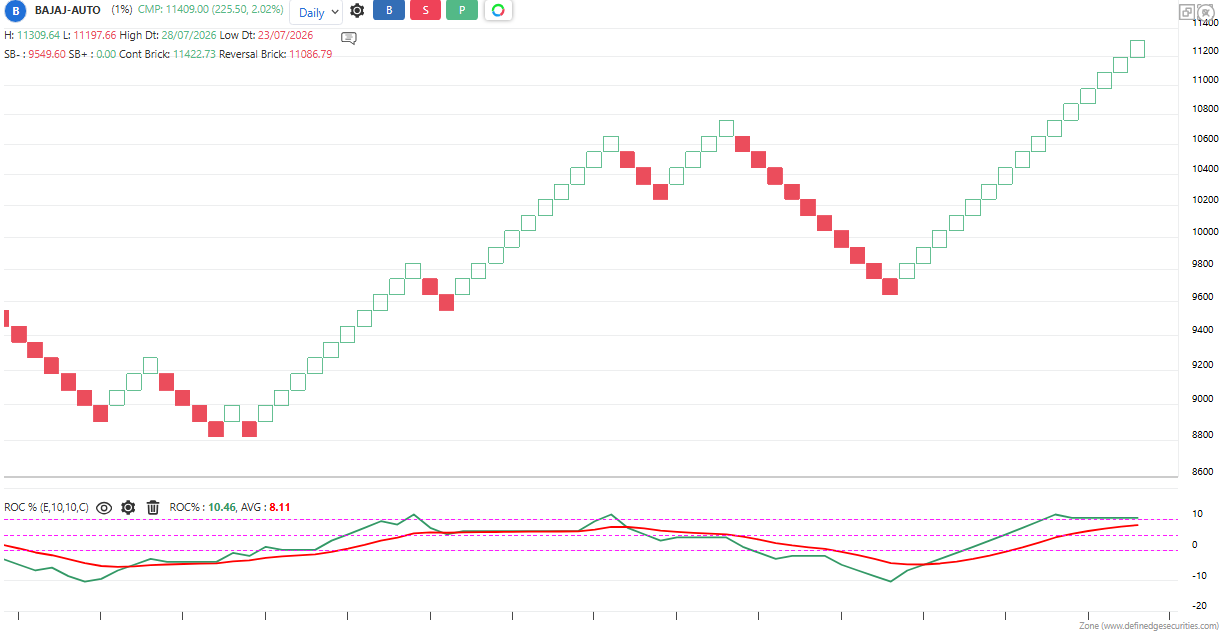
The indicator is applicable to all types of charting. Calculated based on the number of columns on P&F charts, bricks on Renko charts, lines on Line-break charts, candles on Heikin ashi charts, and lines on Kagi charts. While the formula and reading of the indicators remain the same, they become more dynamic on these charts.