Customer Support : 020-61923200, [email protected] | Call and Trade : 020-61923220

TTM Squeeze
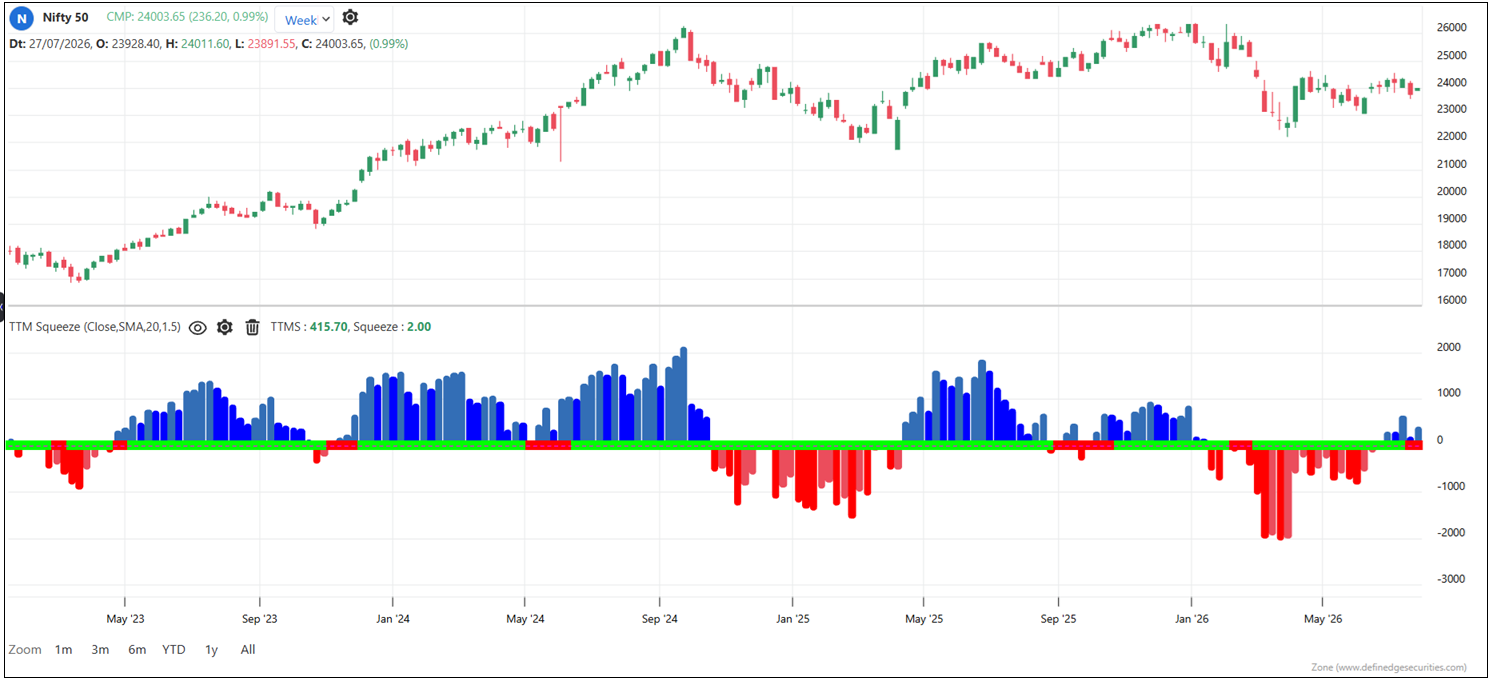
#volatility #momentum #breakout
Inventor: John Carter (Trade The Markets / Simpler Trading)
Default period: 20, 2.0, 1.5 (length; Bollinger Band std dev multiplier; Keltner Channel ATR multiplier)
TTM Squeeze is a volatility and momentum indicator created using popular channel indicators Bolliner bands and Keltner channels.
Both Bollinger bands and Keltner channels are range channels developed using volatility measurement studies. But their calculations are different. Bollinger bands are created using standard deviation. Keltner channels are creating using ATR Average true range) indicator.
These two indicators are used to calculate the volatility squeeze.
When the Bollinger bands are within the Keltner channel bands, it is a low volatility period. It is a period of squeeze. The squeeze is on. When the Bollinger bands are outside of the Keltner bands, there is a volatility expansion. The squeeze is off during such periods. The squeeze goes on and off.
Donchian channel middle band is also calculated in this study and plotted as a histogram. It helps us identify momentum.
When the histogram is bullish, the momentum is bullish. When the histogram is bearish, the momentum is bearish. Rising histogram above zero line shows bullish direction. Falling histrogram below zero line shows bearish direction.
When they have, the market is “in a squeeze” — coiling energy for a breakout. A separate momentum histogram indicates the likely breakout direction. Squeeze status is typically shown as dots on the zero line: red/on = squeeze active, green/off = squeeze released (fired).
When the momentum bars are above zero line but starts falling, you can consider booking profits in the long positions. When the momentum bars below the zero line starts rising, you can consider booking profits in the short positions.
You will see the dots on the zero line of the indicator. When the dot is red, the squeeze is on. When the dot is green, the squeeze is off.
When the squeeze is on, wait for the momentum bars to indicate the direction.
Bollinger Bands inside Keltner Channels indicates compression (squeeze on). Bands expanding back outside the Keltners indicates release (squeeze fired).
Useful readings:
- Squeeze on for 6–10+ bars: Significant energy building, larger move expected on release
- Squeeze fires with positive rising momentum: Bullish breakout, long bias
- Squeeze fires with negative falling momentum: Bearish breakdown, short bias
- Momentum histogram fading toward zero after fire: Move exhausting, tighten stops
- Very short squeeze (1–2 bars): Weak compression, breakout less reliable
- Repeated squeezes without follow-through: Range-bound regime, fade extremes instead of chasing breaks
- Squeeze on higher timeframe aligning with lower timeframe fire: Strongest setups (multi-timeframe stacking)
Objective rules:
- Squeeze ON: Upper BB < Upper KC AND Lower BB > Lower KC
- Squeeze OFF (fired): First bar where either band closes back outside the Keltner Channel
- Long entry: Squeeze fires AND momentum histogram > 0 and rising
- Short entry: Squeeze fires AND momentum histogram < 0 and falling
- Exit (Carter’s original rule): Exit when momentum histogram ticks against you (first bar of deceleration), or after 8–10 bars
- Duration filter: Require squeeze to have lasted at least 5 bars before trading the fire
What makes it unique:
It answers when to expect a move, not which way price is drifting — most indicators do the opposite. By requiring one volatility measure (Bollinger, std-dev based) to fit inside another (Keltner, ATR based), it turns “low volatility” from a vague observation into a binary, backtestable condition, and pairs it with a momentum gauge so compression and direction are read together in one panel.
Connecting it back to your spreadsheet: your body-contraction metric and the TTM Squeeze measure the same underlying phenomenon — volatility compression — but yours uses candle bodies while TTM uses full-range statistics. Your Contraction Ratio column (5D/20D) is conceptually the “squeeze on” condition, and a fire would be the ratio snapping back above 1 with an expanding body in one direction.
Using three popular channel indicators, this indicator allows you to identify the trend, momentum, and squeeze in one study.
The indicator table value in TradePoint & RZone also provides you with a list of all values of this indicator for any group of stocks. This will allow you to compare the readings of this indicator across different stocks.
The indicator is applicable to all types of charting. Calculated based on the number of columns on P&F charts, bricks on Renko charts, lines on Line-break charts, candles on Heikin ashi charts, and lines on Kagi charts. While the formula and reading of the indicators remain the same, they become more dynamic on these charts.
This indicator is also available in the System Builder of RZone & TradePoint for all charting methods. Using the system builder, you can develop various strategies based on the different conditions already present in this indicator. Additionally, it can be used with other indicators or price patterns to develop effective trading strategies. For any group of stocks and market segments, you can scan and backtest stocks based on those strategies.