Customer Support : 020-61923200, [email protected] | Call and Trade : 020-61923220
Stretch
#intraday #breakout #openingrange
Inventor: Toby Crabel
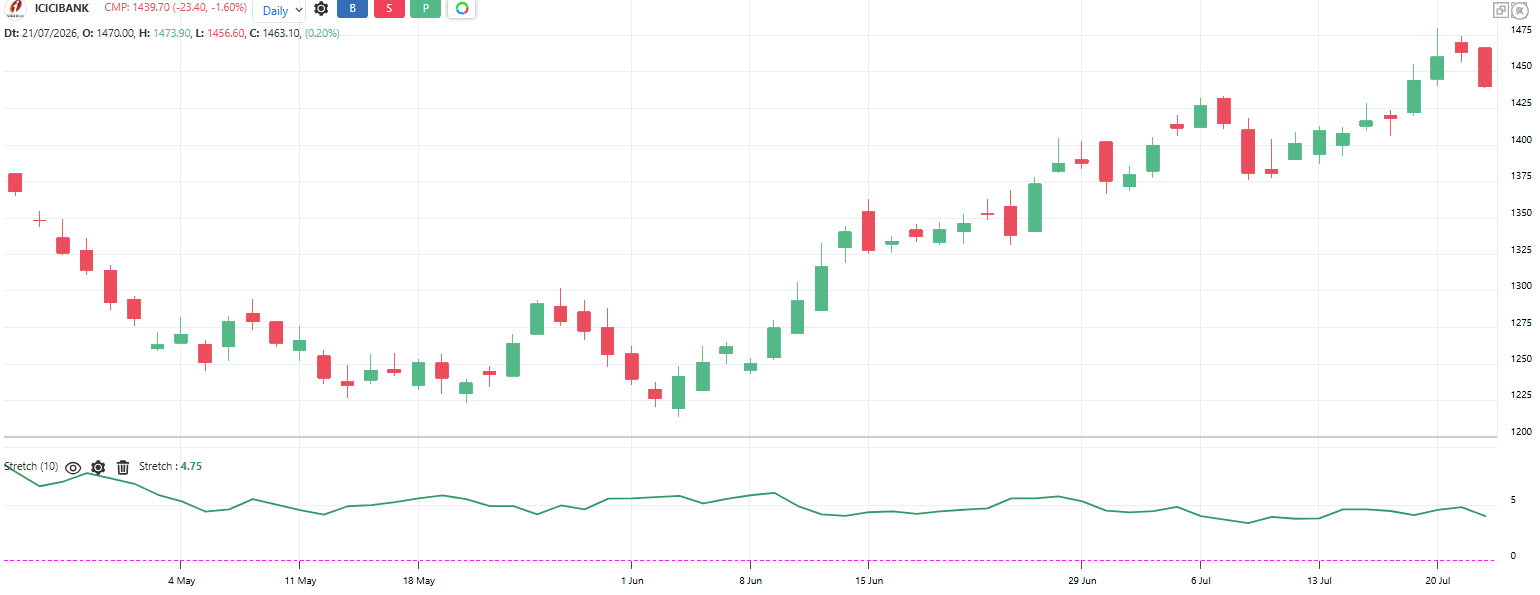
Toby Crabel’s measure of the market’s normal morning probe. For each of the last 10 days it takes the smaller of (High – Open) and (Open – Low) – the distance price poked against its final direction. The 10-day average of this is the Stretch. Added above and below today’s open, it gives breakout levels: once price travels more than its normal probe distance, the day has likely picked its direction.
Default period: 10 days
Buy level = Open + Stretch. Sell level = Open – Stretch.
Small Stretch indicates quiet opens, tight breakout levels. Large Stretch indicates wild opens, wide levels.
Useful readings:
Price crosses Open + Stretch: Upside breakout, day leaning bullish
Price crosses Open – Stretch: Downside breakout, day leaning bearish
Price stays between the levels all morning: Indecisive day, range trading
First level hit often sets the day’s direction, especially on trend days
Both levels hit same day: Whipsaw day, stand aside or cut size
Works best on index futures and liquid stocks, per Crabel’s research
Objective rules:
Bullish: Price trades above Open + Stretch.
Bearish: Price trades below Open – Stretch.
ORB entry: Buy stop at Open + Stretch, sell stop at Open – Stretch, cancel one when the other fills
Stop-loss rule: Initial stop at the opposite Stretch level or the open, whichever is closer
One-shot rule: If stopped out and the opposite level triggers, take at most one reverse trade, then stop for the day
What makes it unique:
It quantifies the market’s normal morning head-fake and turns it into precise breakout levels off the open. It is the numerical heart of Crabel’s opening-range-breakout research.
The indicator table value in TradePoint & RZone also provides you with a list of all values of this indicator for any group of stocks. This will allow you to compare the readings of this indicator across different stocks.
This indicator is also available in the System Builder of RZone & TradePoint for all charting methods. Using the system builder, you can develop various strategies based on the different conditions already present in this indicator. Additionally, it can be used with other indicators or price patterns to develop effective trading strategies. For any group of stocks and market segments, you can scan and backtest stocks based on those strategies.
The indicator is applicable to all types of charting. Calculated based on the number of columns on P&F charts, bricks on Renko charts, lines on Line-break charts, candles on Heikin ashi charts, and lines on Kagi charts. While the formula and reading of the indicators remain the same, they become more dynamic on these charts.
`