Customer Support : 020-61923200, [email protected] | Call and Trade : 020-61923220
Triple VWAP Indicator
#intraday #volume #crossover
Inventor:
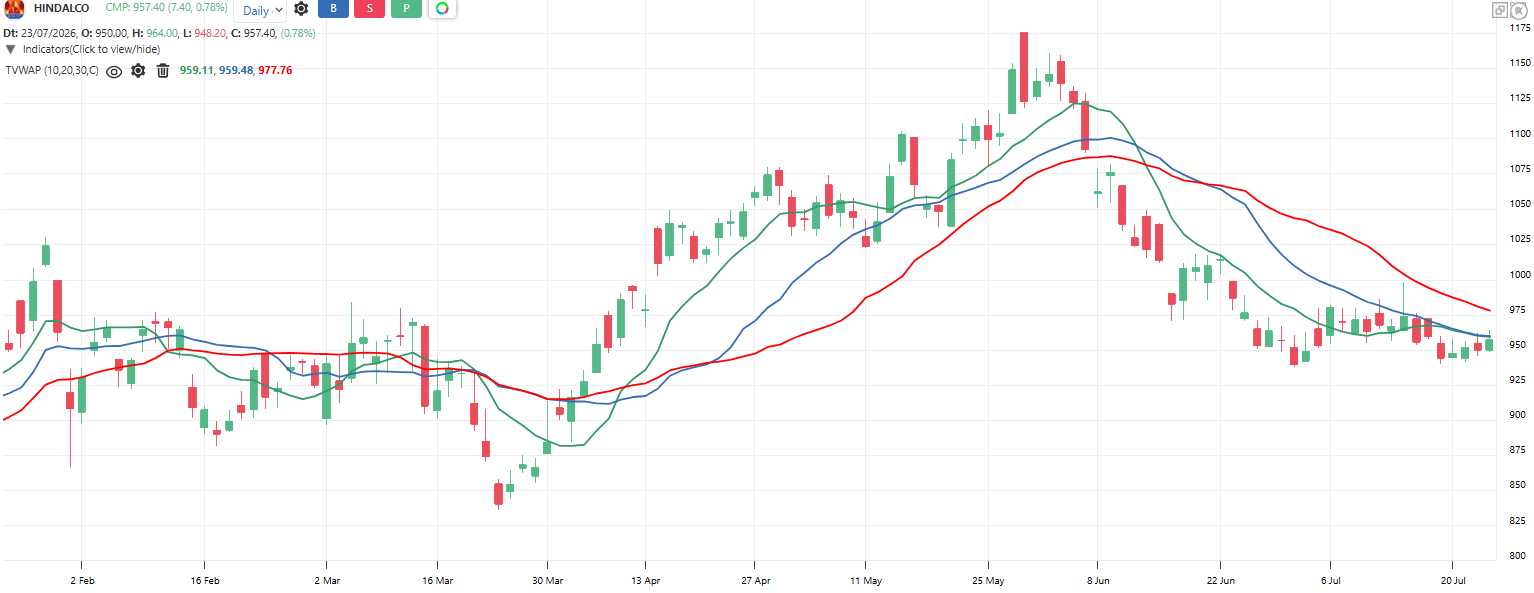
Three moving VWAP lines of different lengths – the volume-weighted version of the triple moving average. Fast gives the alert, medium confirms, slow defines the volume-weighted trend. Because every line is weighted by traded volume, the stack shows where real money agrees, not just price.
Default period: 10, 20, 30 (fast, medium, slow MVWAP)
All three stacked fast above medium above slow indicates a volume-backed uptrend. Stacked the opposite way indicates a volume-backed downtrend.
Useful readings:
Fast crosses above medium: Volume-weighted turn starting
Perfect bullish stack: Buyers dominant at every horizon, hold longs
Perfect bearish stack: Sellers dominant at every horizon, hold shorts
Fast dips to medium and bounces in a stack: Dip absorbed by volume, trend continues
Lines braided together: No volume conviction, stand aside
Slightly slower than plain MAs but steadier in liquid, high-volume names
Objective rules:
Bullish: Fast MVWAP crosses above medium MVWAP AND both are above the slow MVWAP.
Bearish: Fast MVWAP crosses below medium MVWAP AND both are below the slow MVWAP.
Long exit: Fast MVWAP crosses back below the medium MVWAP
Boss filter: Take longs only above the slow MVWAP, shorts only below it
Chop filter: Skip signals if fast and medium crossed more than twice in last 15 bars
What makes it unique:
It layers the triple-crossover hierarchy onto volume-weighted lines, demanding that all horizons of real money agree. Full stacks here are rarer and more meaningful than plain MA stacks.
The indicator table value in TradePoint & RZone also provides you with a list of all values of this indicator for any group of stocks. This will allow you to compare the readings of this indicator across different stocks.
This indicator is also available in the System Builder on RZone & TradePoint for all charting methods. Using the system builder, you can develop various strategies based on the different conditions already present in this indicator. Additionally, it can be used with other indicators or price patterns to develop effective trading strategies. For any group of stocks and market segments, you can scan and backtest stocks based on those strategies.
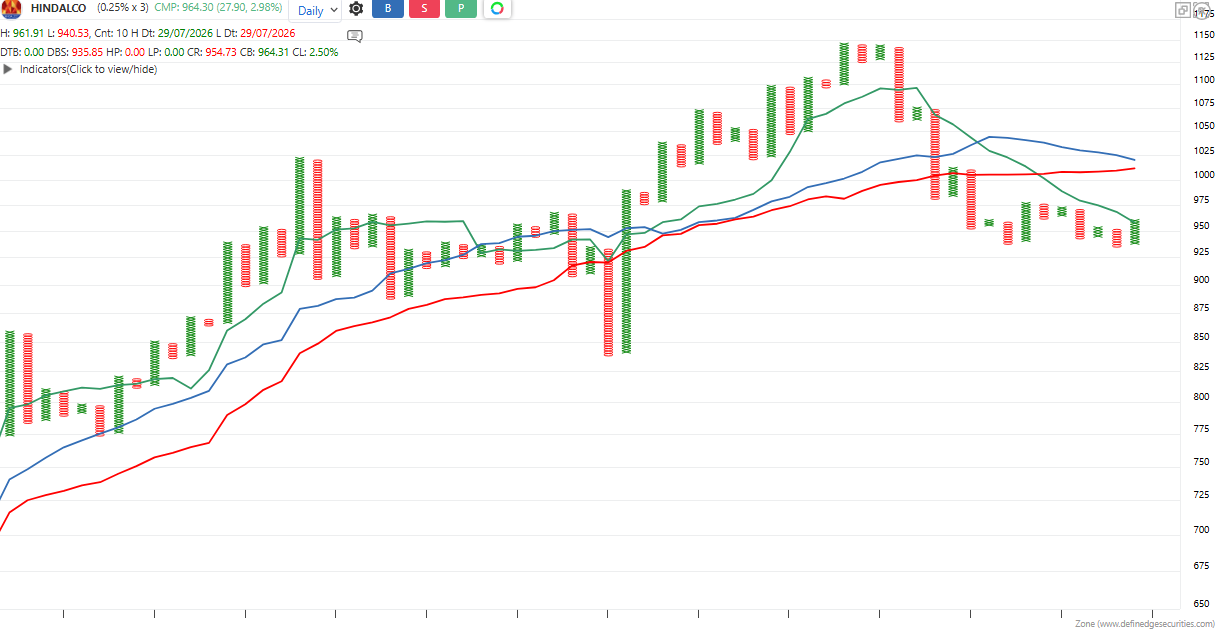
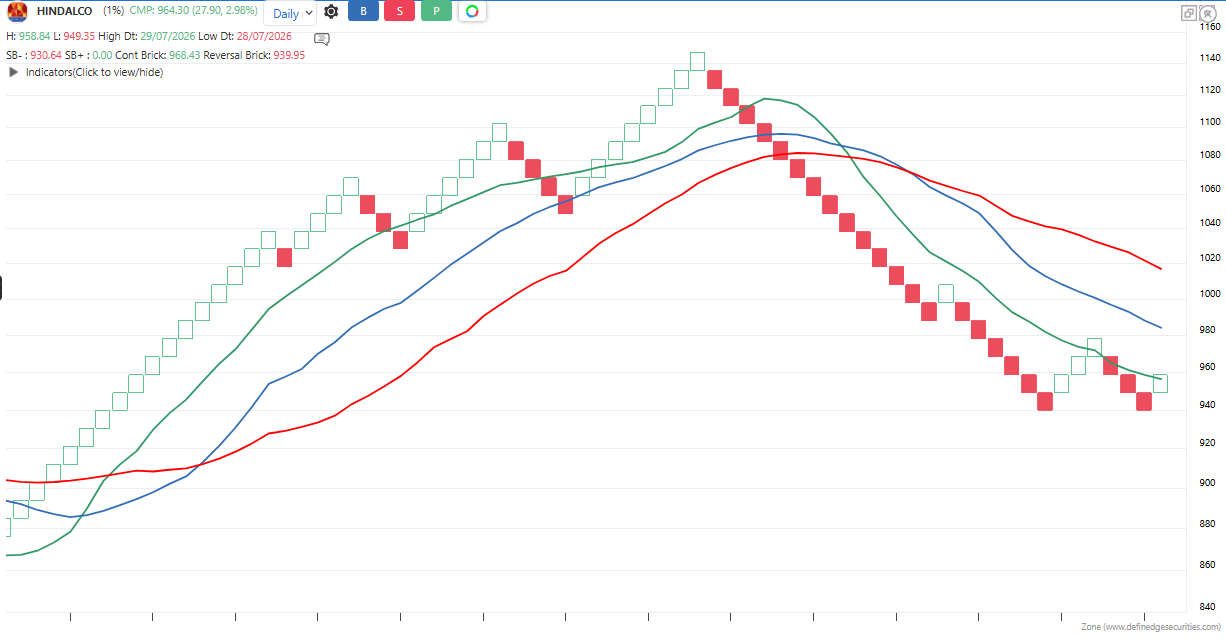
The indicator is applicable to all types of charting. It is calculated based on the number of columns on P&F charts, bricks on Renko charts, lines on Line-break charts, candles on Heikin-Ashi charts, and lines on Kagi charts. While the formula and reading of the indicators remain the same, they become more dynamic on these charts.