Customer Support : 020-61923200, [email protected] | Call and Trade : 020-61923220

Bollinger Bandwidth
#volatility #bollinger #squeeze #expansion
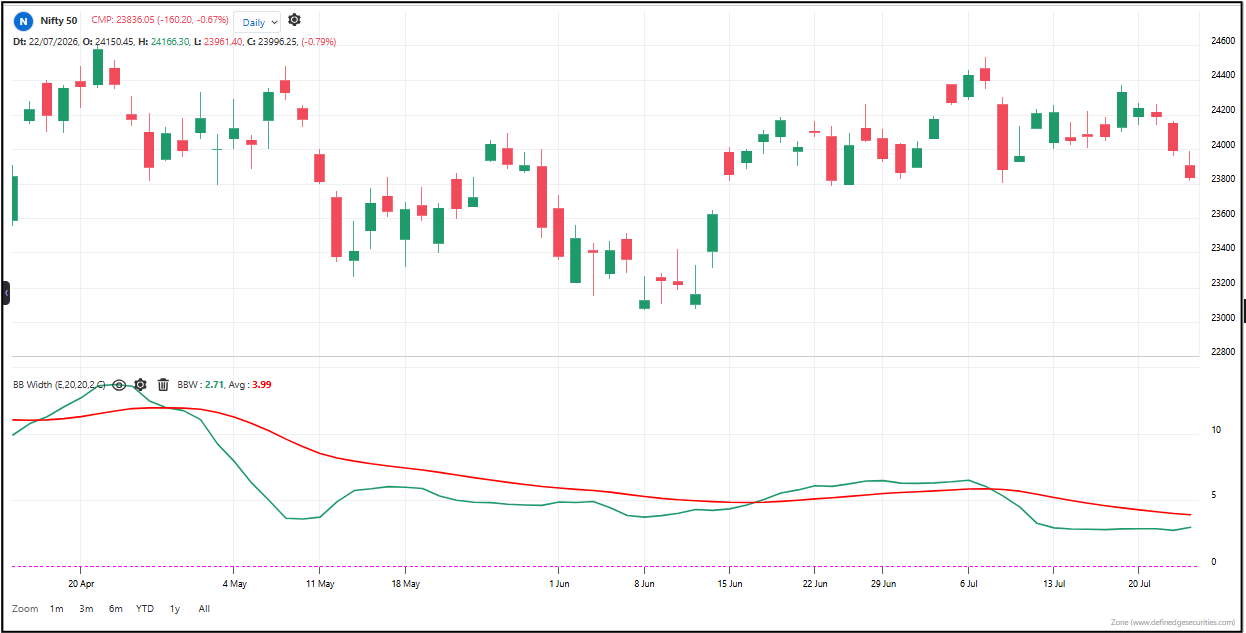
Bollinger Bandwidth tells you whether volatility is compressing or expanding — by measuring how wide or narrow the Bollinger Bands are relative to their centerline. When the bands squeeze together, Bandwidth falls — volatility is collapsing and a big move is loading up. When the bands spread apart, Bandwidth rises — volatility is exploding and the move is underway.
Default period: 20 (standard Bollinger Band period)
How to read it:
A single line that moves up and down. Low readings mean the Bollinger Bands are narrow — the market is quiet, compressed, and coiled. High readings mean the bands are wide — the market is volatile, expanded, and moving fast. The line doesn’t tell you direction (up or down) — it tells you intensity. Think of it as a volatility thermometer.
Useful readings:
– Falling to lows — the squeeze is tightening. Volatility is collapsing. A big move is coming. Direction is unknown, but the size will be significant.
– Rising from lows — the squeeze has broken. Volatility is exploding. The big move is happening. Trade in the direction of the break.
– At extreme highs — volatility is maxed out. The move is exhausted. Expect the bands to start contracting again.
– Stable at moderate levels — normal volatility. No squeeze, no explosion. The market is behaving normally.
– Multiple squeeze cycles — each squeeze leads to a bigger move. The longer the squeeze, the bigger the explosion.
Use cases:
– Breakout trading: Wait for Bandwidth to hit a multi-period low (the squeeze), then enter when price breaks out of the narrow bands. The move will be fast and powerful.
– Volatility filter: Only trade when Bandwidth is rising from lows — that’s when the big moves happen. Avoid trading when Bandwidth is at highs — the move is over.
– Risk management: When Bandwidth is at extreme highs, tighten stops. Volatility is maxed out and a sharp reversal is likely.
– Position sizing: Larger positions after deep squeezes (high-probability big moves). Smaller positions when Bandwidth is already elevated (the move may be over).
Objective rules:
– Watch for Bandwidth to hit a multi-period low — that’s your squeeze alert.
– Enter when price breaks above the upper band (long) or below the lower band (short) after the squeeze.
– Exit when Bandwidth reaches extreme highs — the volatility move is exhausted.
– Avoid trading when Bandwidth is stable at moderate levels — no edge in normal volatility.
– The deeper the squeeze (lower the Bandwidth), the bigger the expected move. Size accordingly.
What makes it unique: Most volatility indicators tell you how volatile the market is right now. Bollinger Bandwidth tells you where volatility is headed. A falling Bandwidth means volatility is about to explode. A rising Bandwidth means the explosion is already happening. It’s the difference between seeing a coiled spring and seeing the spring already released. That’s why it’s the go-to tool for breakout traders.
The indicator table value in TradePoint & RZone also provides you with a list of all values of this indicator for any group of stocks. This will allow you to compare the readings of this indicator across different stocks.
This indicator is also available in the System Builder of RZone & TradePoint for all charting methods. Using the system builder, you can develop various strategies based on the different conditions already present in this indicator. Additionally, it can be used with other indicators or price patterns to develop effective trading strategies. For any group of stocks and market segments, you can scan and backtest stocks based on those strategies.
The indicator is applicable to all types of charting. Calculated based on the number of columns on P&F charts, bricks on Renko charts, lines on Line-break charts, candles on Heikin ashi charts, and lines on Kagi charts. While the formula and reading of the indicators remain the same, they become more dynamic on these charts.