Customer Support : 020-61923200, [email protected] | Call and Trade : 020-61923220

Chikou Span
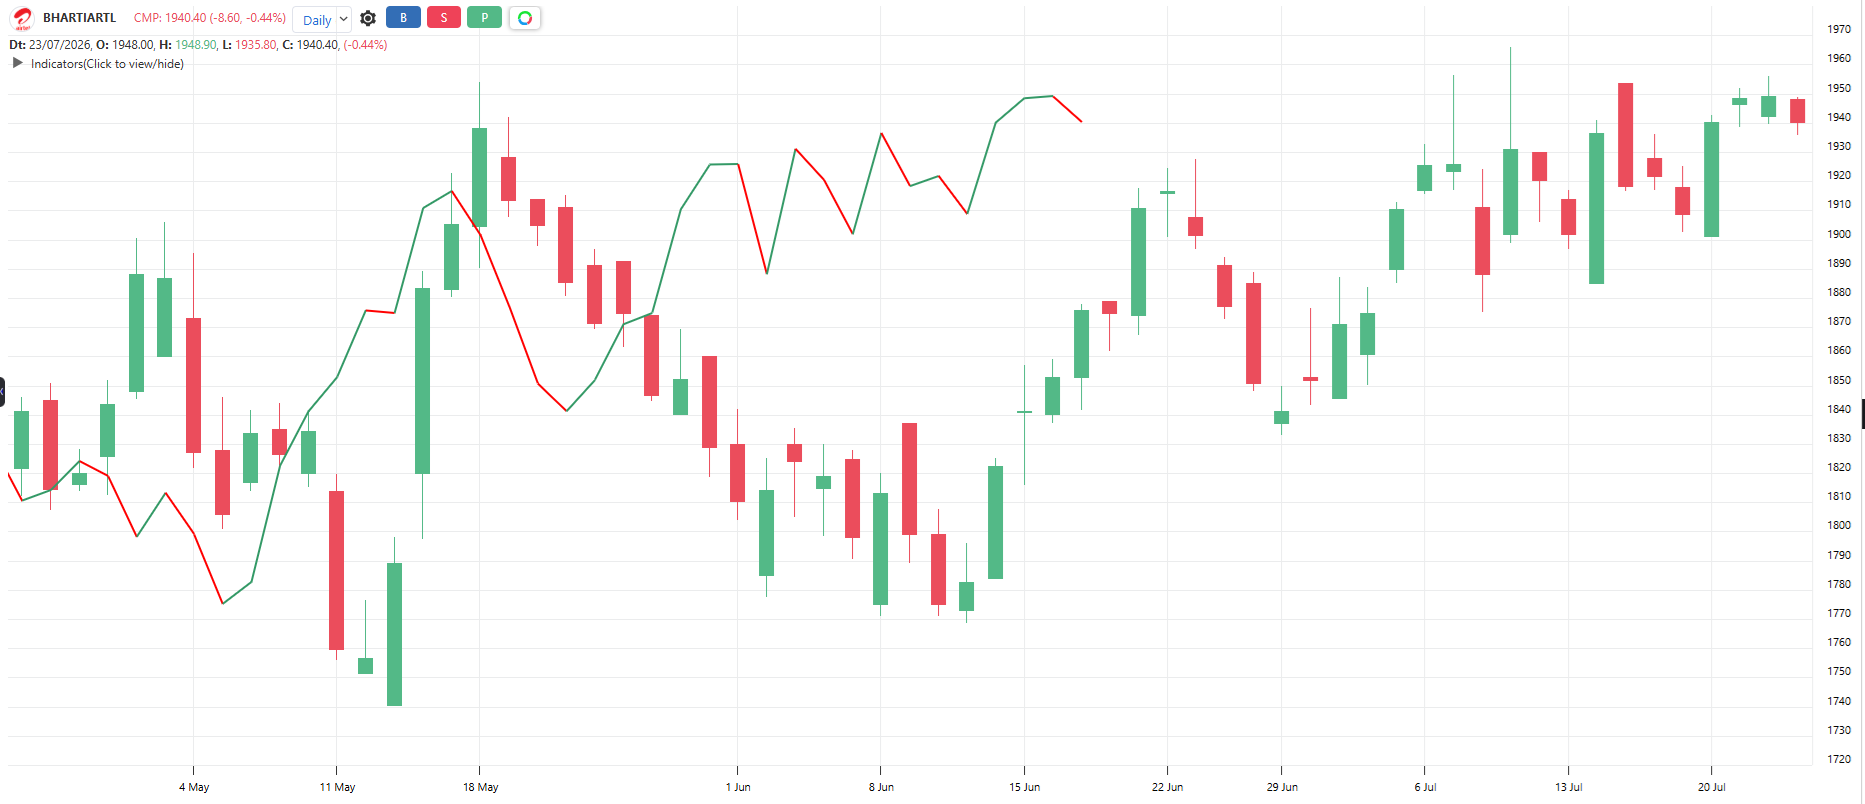
#trendfollowing #ichimoku
Inventor: Goichi Hosoda
One line from the Ichimoku system, useful on its own. It is simply today’s closing price drawn 26 bars back on the chart. This lets you compare today’s price with the price 26 bars ago in one glance: if the line sits above those old candles, today’s buyers are winning against everyone from 26 bars back.
Default period: 26 (bars shifted back)
Chikou above the old price candles indicates bullish strength. Chikou below the old candles indicates bearish strength.
Useful readings:
Chikou above price of 26 bars ago: Uptrend confirmed
Chikou below price of 26 bars ago: Downtrend confirmed
Chikou cutting through the old candles: Trend unclear, sideways zone
Chikou in clear open space (no candles near it): Strong clean trend
Chikou approaching old candles from above: Uptrend may face a fight
Use it as a confirmation, not a standalone entry signal
Objective rules:
Bullish: Chikou crosses above the price of 26 bars ago.
Bearish: Chikou crosses below the price of 26 bars ago.
Confirmation rule: Take long signals from other tools only when Chikou is above the old candles
Clean-space filter: Prefer trades where Chikou has open space ahead of it
What makes it unique:
It is the only line in charting that compares today with the past by physically drawing today in the past. One glance shows whether current buyers beat everyone from 26 bars ago.
The indicator table value in TradePoint & RZone also provides you with a list of all values of this indicator for any group of stocks. This will allow you to compare the readings of this indicator across different stocks.
This indicator is available in the System Builder on RZone & TradePoint for all charting methods. Using the system builder, you can develop various strategies based on the different conditions already present in this indicator. Additionally, it can be used with other indicators or price patterns to develop effective trading strategies. For any group of stocks and market segments, you can scan and backtest stocks based on those strategies.
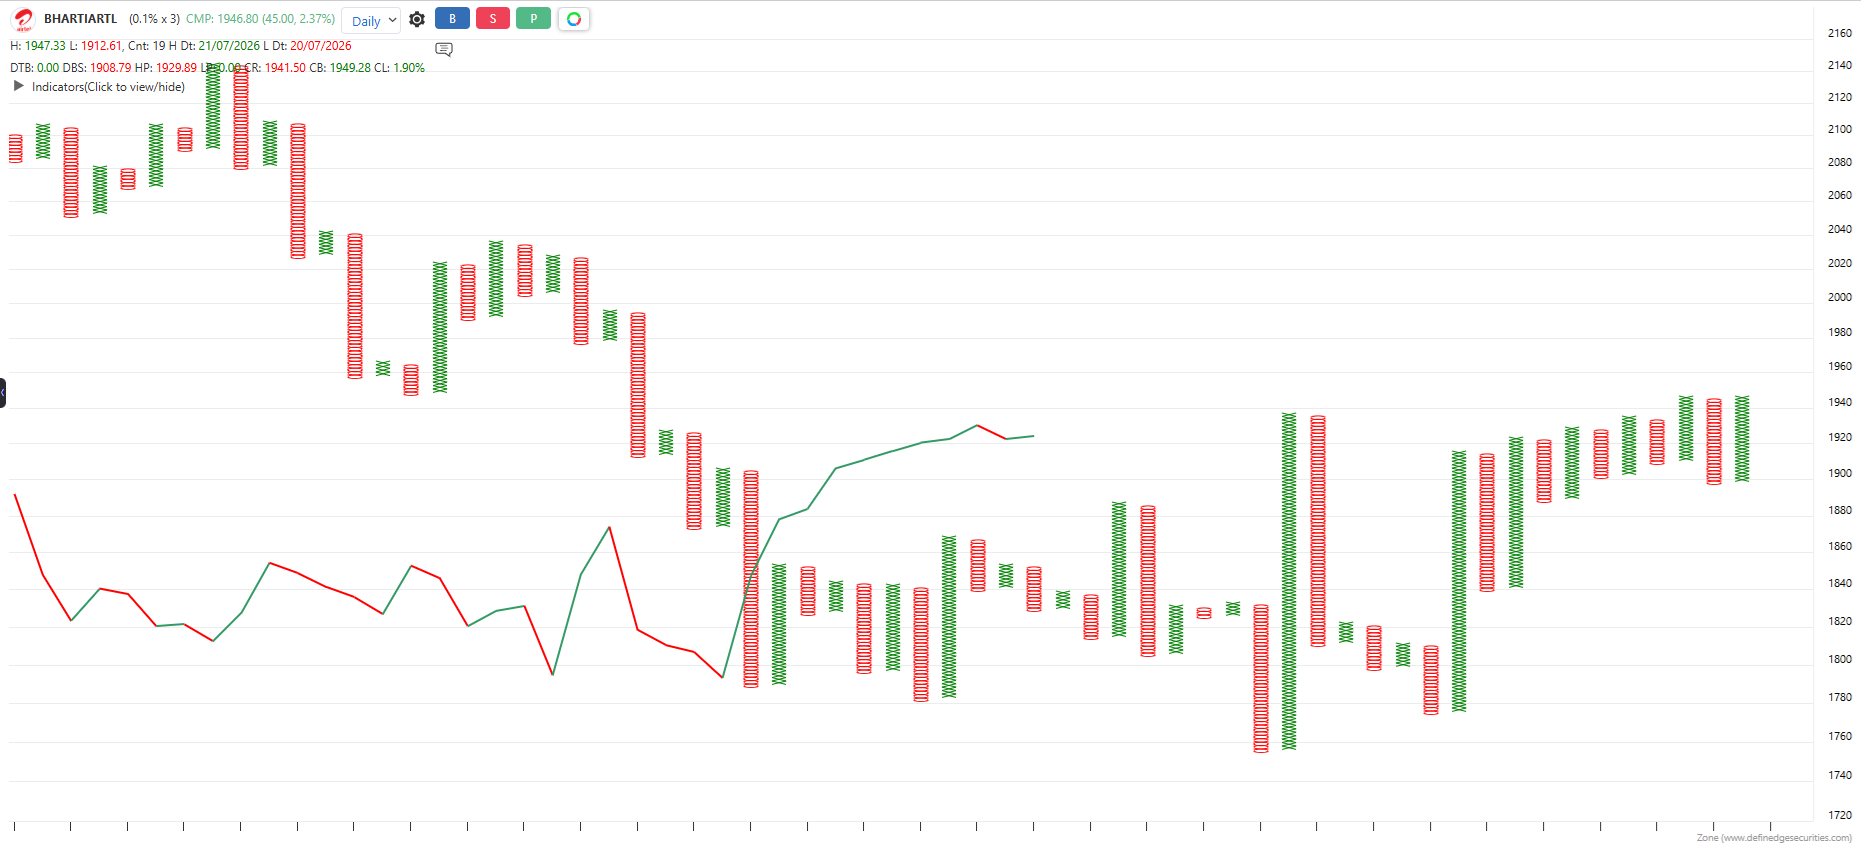
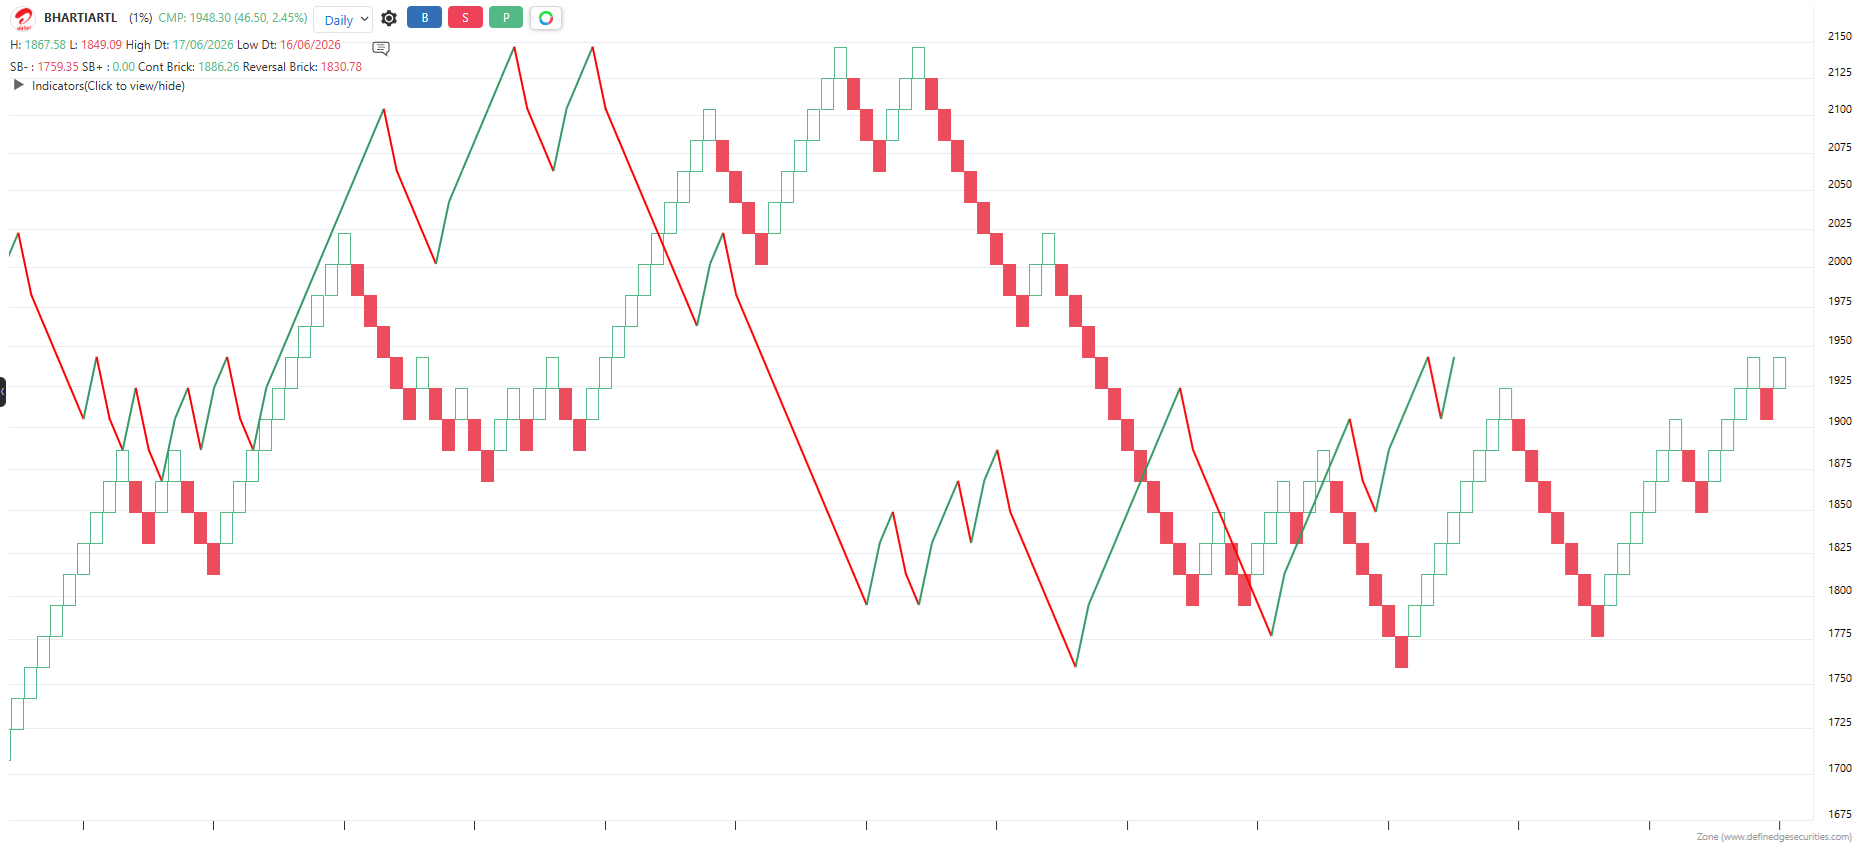
The indicator is applicable to all types of charting. It is calculated based on the number of columns on P&F charts, bricks on Renko charts, lines on Line-break charts, candles on Heikin-Ashi charts, and lines on Kagi charts. While the formula and reading of the indicators remain the same, they become more dynamic on these charts.