Customer Support : 020-61923200, [email protected] | Call and Trade : 020-61923220
MA Envelope
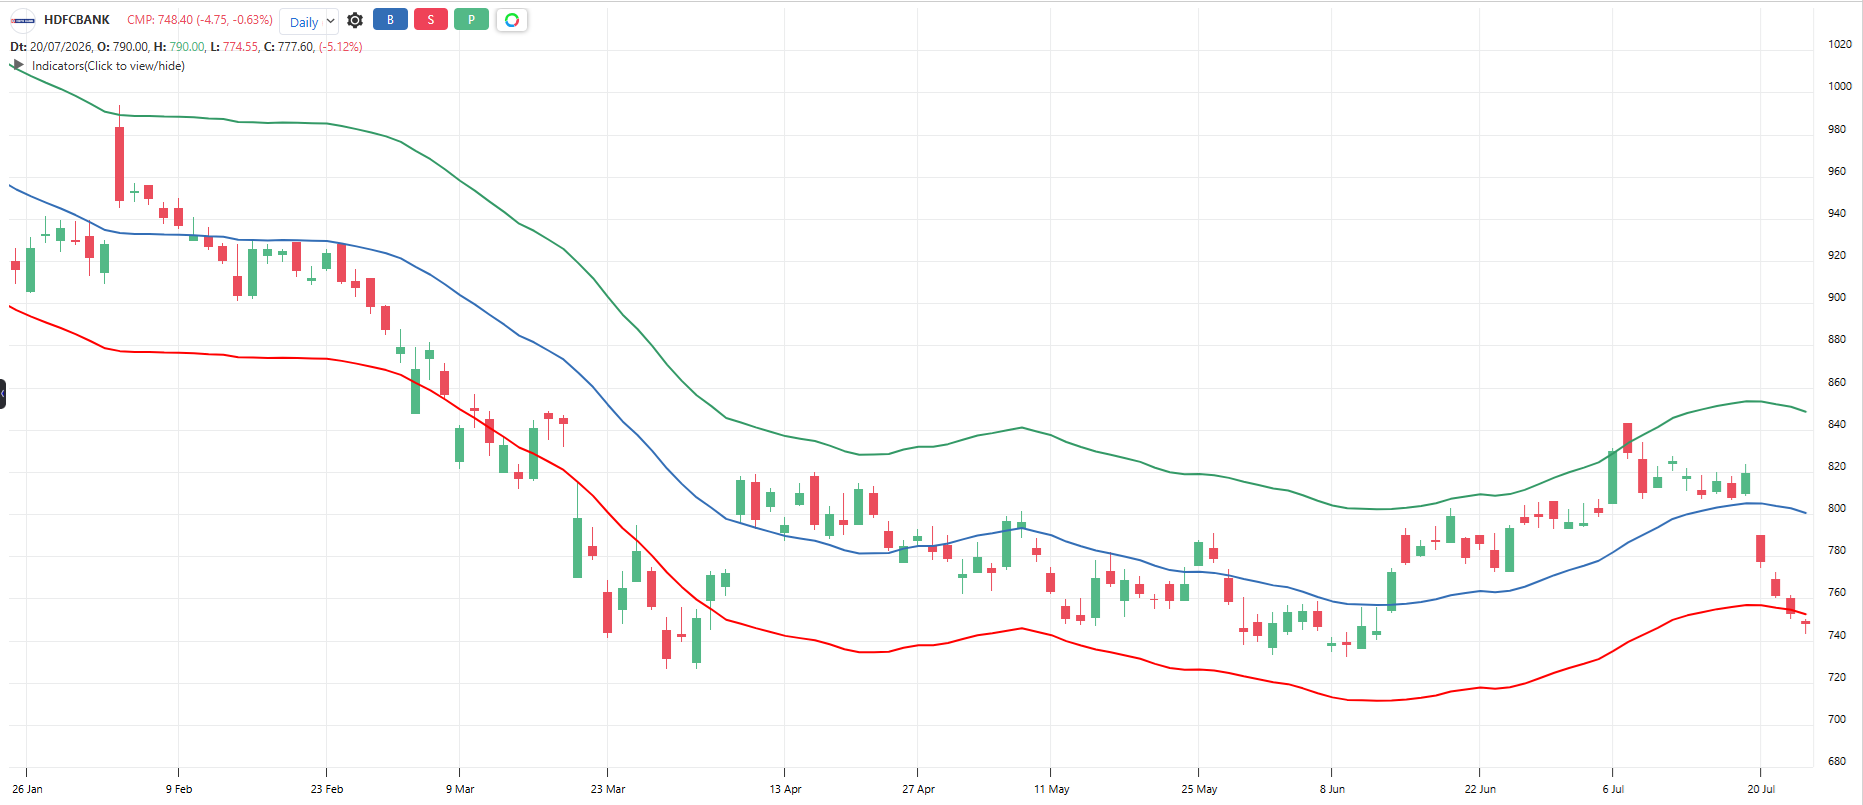
#movingaverage #meanreversion #channel
A moving average with two bands drawn a fixed percentage above and below it, forming a price corridor. Unlike Bollinger Bands the width never changes with volatility, so touches of the bands always mean the same stretch from the average.
Default period: 20, 6% (MA period, envelope percent; tune percent per stock)
Price near the upper band indicates stretched above average. Price near the lower band indicates stretched below average.
Useful readings:
Price touches upper band in a sideways market: Overbought, pullback likely
Price touches lower band in a sideways market: Oversold, bounce likely
Price rides the upper band: Strong uptrend, do not fade it
Price crosses the middle MA: Short-term trend shifting
Bands act as profit-booking zones in range markets
Set the percent so about 90% of recent price action stays inside the bands
Objective rules:
Bullish: Price closes above the middle moving average.
Bearish: Price closes below the middle moving average.
Range buy: Price touches lower band AND closes back inside (only in sideways market)
Range sell: Price touches upper band AND closes back inside (only in sideways market)
Trend filter: Skip fade trades when ADX is above 25 or price is riding a band
What makes it unique:
Its fixed-percentage bands never change width, so every band touch means exactly the same stretch. That constancy makes its signals directly comparable across months.
The indicator table value in TradePoint & RZone also provides you with a list of all values of this indicator for any group of stocks. This will allow you to compare the readings of this indicator across different stocks.
This indicator is also available in the System Builder of RZone & TradePoint for all charting methods. Using the system builder, you can develop various strategies based on the different conditions already present in this indicator. Additionally, it can be used with other indicators or price patterns to develop effective trading strategies. For any group of stocks and market segments, you can scan and backtest stocks based on those strategies.
The indicator is applicable to all types of charting. Calculated based on the number of columns on P&F charts, bricks on Renko charts, lines on Line-break charts, candles on Heikin ashi charts, and lines on Kagi charts. While the formula and reading of the indicators remain the same, they become more dynamic on these charts.