Customer Support : 020-61923200, [email protected] | Call and Trade : 020-61923220

High Low Indicator
#range #support #resistance #dynamic
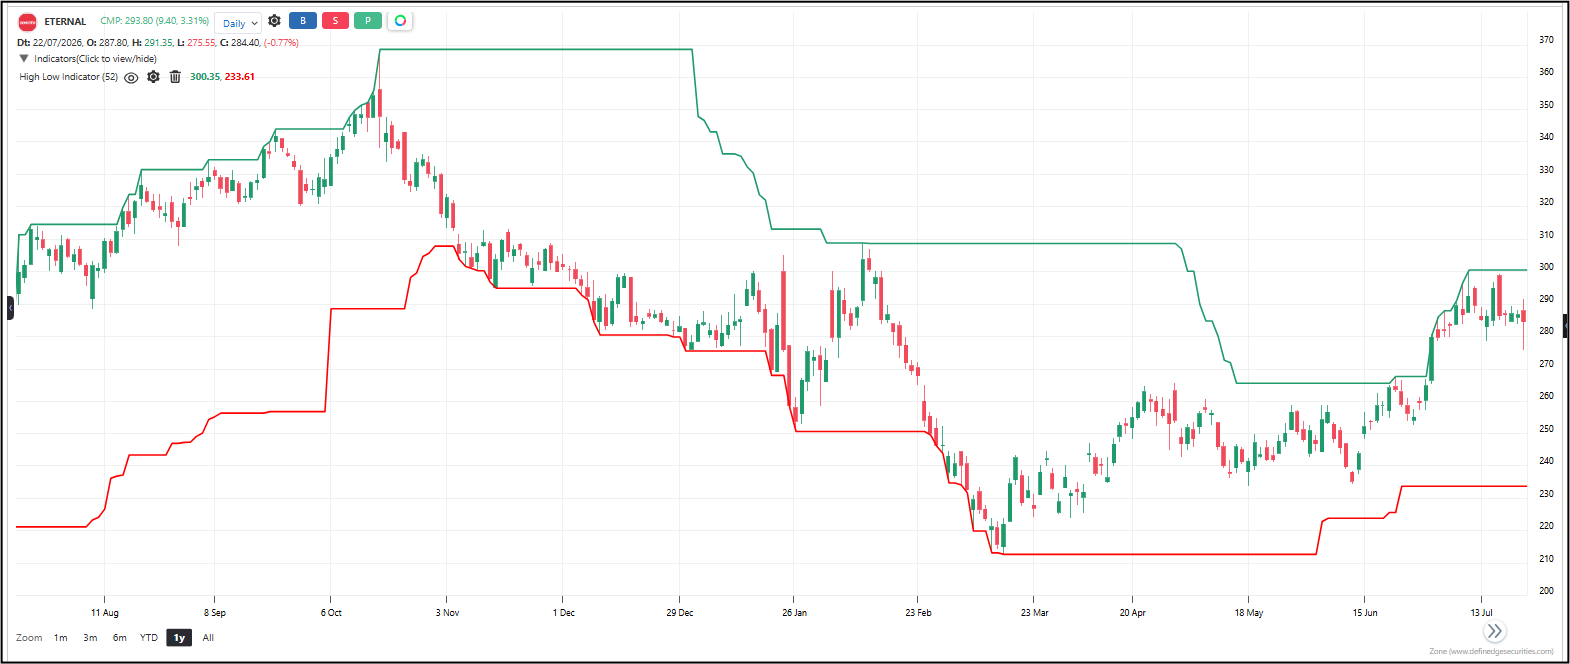
High-Low Indicator plots the highest high and lowest low over a rolling period directly on your chart. The High line acts as dynamic resistance. The Low line acts as dynamic support. When the High line rises, resistance is moving up — a bullish sign. When the Low line falls, support is moving down — a bearish sign. The indicator offers two modes: one based on the actual high and low prices, and another based on closing prices.
Default period: 52
Line behavior: Two lines are plotted on the chart. The High line traces the highest point price has reached over the lookback period. The Low line traces the lowest point. Together they form an expanding or contracting channel around price. When both lines rise, the market is in an uptrend channel. When both lines fall, the market is in a downtrend channel. When they flatten, the market is ranging.
Useful readings:
– High line rising — resistance keeps getting pushed higher. Bullish structure.
– Low line rising — support keeps getting pushed higher. Strong bullish structure.
– High line falling — resistance is being driven lower. Bearish structure.
– Low line falling — support keeps getting pushed lower. Strong bearish structure.
– Price touching the High line — testing dynamic resistance. A breakout above confirms strength.
– Price touching the Low line — testing dynamic support. A breakdown below confirms weakness.
– Channel narrowing — both lines converging. Volatility is compressing. A big move is likely coming.
– Channel widening — both lines diverging. Volatility is expanding. The trend has room to run.
Objective rules:
– Go long when the High line is rising and price bounces off the Low line.
– Go short when the Low line is falling and price rejects the High line.
– Go long on breakout when price closes above the High line and the High line starts rising.
– Go short on breakdown when price closes below the Low line and the Low line starts falling.
– Exit long when the High line stops rising or starts falling.
– Exit short when the Low line stops falling or starts rising.
– Avoid trading when both lines are flat — the market is range-bound with no directional structure.
What makes it unique: It replaces static support and resistance levels with live, adaptive lines that follow actual price extremes. You don’t need to draw horizontal lines or guess where pivots are — the indicator draws them for you and updates them every bar.
The indicator table value in TradePoint & RZone also provides you with a list of all values of this indicator for any group of stocks. This will allow you to compare the readings of this indicator across different stocks.
This indicator is also available in the System Builder of RZone & TradePoint for all charting methods. Using the system builder, you can develop various strategies based on the different conditions already present in this indicator. Additionally, it can be used with other indicators or price patterns to develop effective trading strategies. For any group of stocks and market segments, you can scan and backtest stocks based on those strategies.
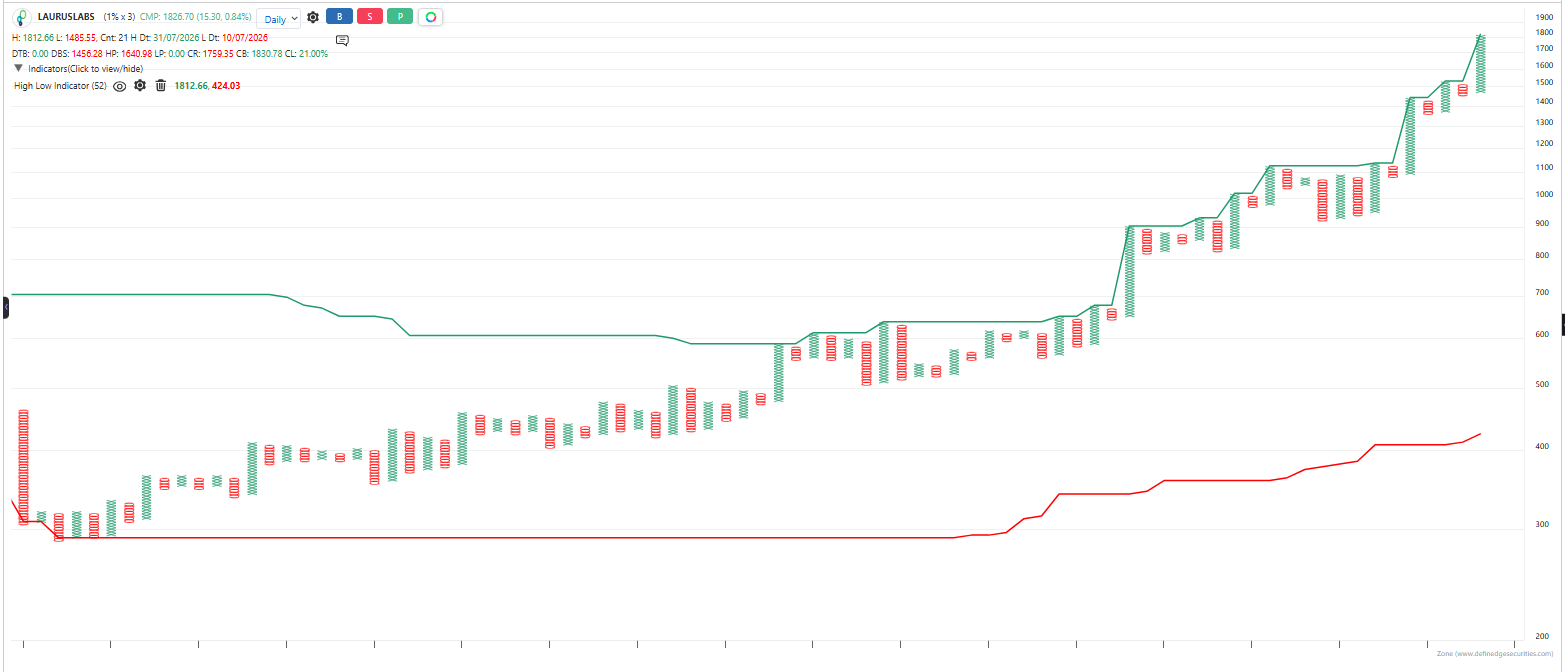
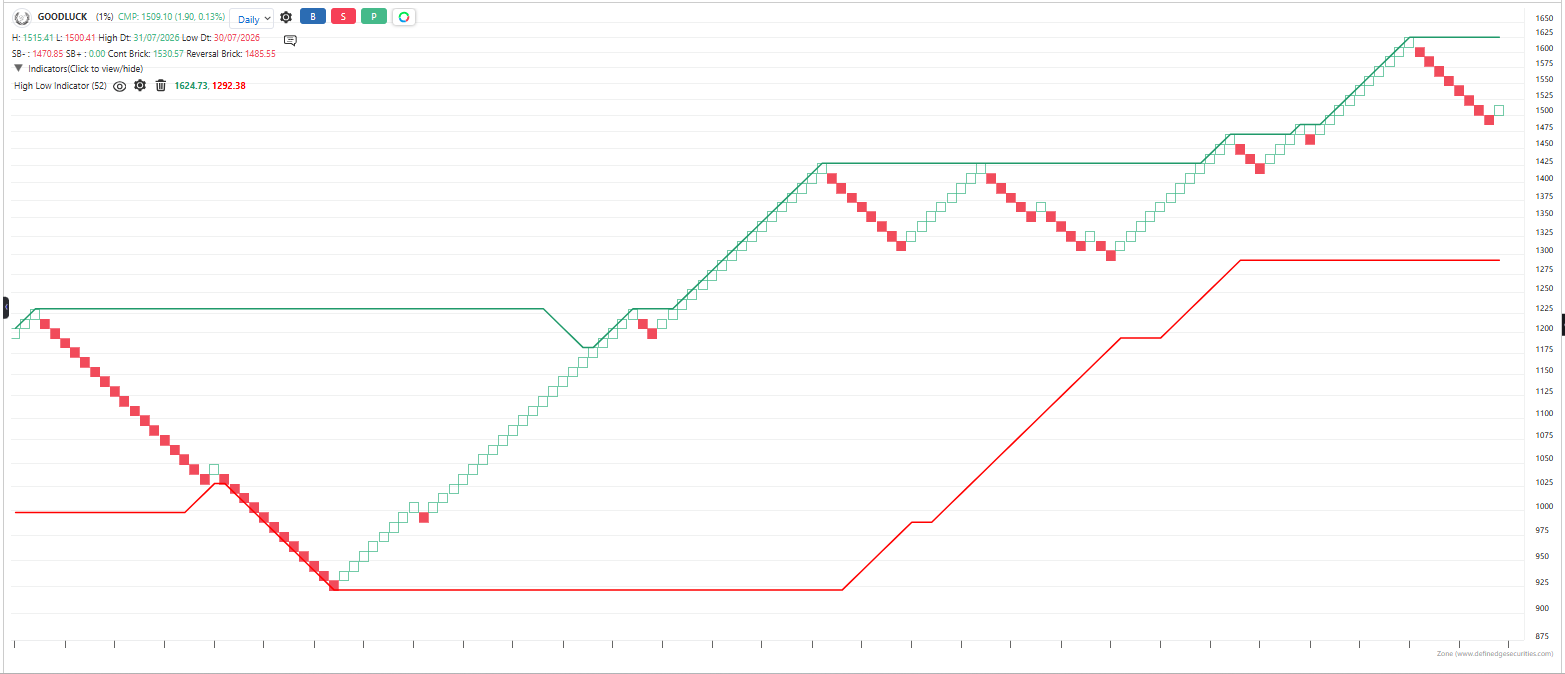
The indicator is applicable to all types of charting. Calculated based on the number of columns on P&F charts, bricks on Renko charts, lines on Line-break charts, candles on Heikin ashi charts, and lines on Kagi charts. While the formula and reading of the indicators remain the same, they become more dynamic on these charts.