Customer Support : 020-61923200, [email protected] | Call and Trade : 020-61923220

Senkou Span B
#trendfollowing #ichimoku #supportresistance
Inventor: Goichi Hosoda
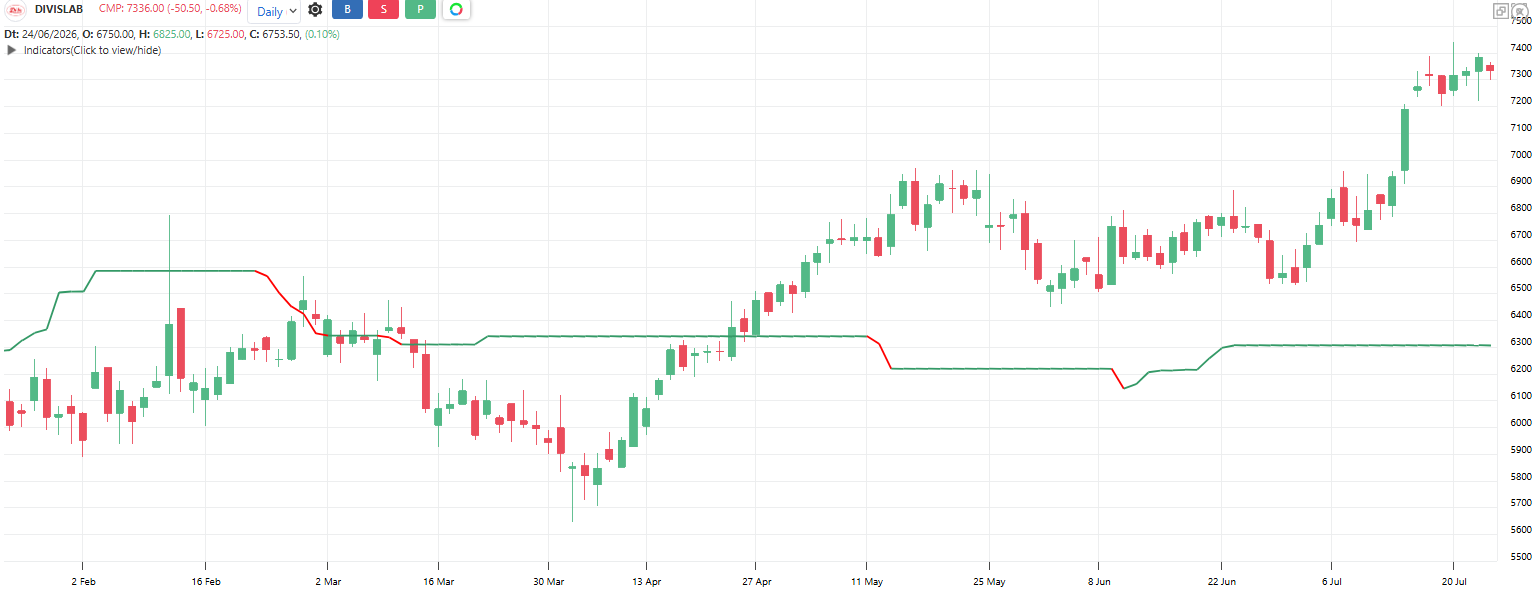
The slower boundary of the Ichimoku Cloud, useful on its own. It is the midpoint of the last 52 bars’ high-low range – (52-bar High + 52-bar Low) / 2 – drawn 26 bars ahead on the chart. Because it uses such a long range and moves in flat steps, it marks the strongest support/resistance level in the whole Ichimoku system. Flat stretches of Senkou B act like price magnets and walls.
Default period: 52, shifted 26 bars forward
Price above Senkou B indicates the bigger battle is won by bulls. Price below indicates bears hold the bigger ground.
Flat Senkou B marks a strong balance level that price respects and gets attracted to.
Useful readings:
Price holds above a flat Senkou B: Strong floor under the market
Price fails repeatedly at Senkou B from below: Strong ceiling
Price crosses a flat Senkou B: Major level broken, big move possible
Long flat Senkou B stretch nearby: Expect price to get pulled toward it
Senkou B rising: Long-term structure improving
Cloud twist (Senkou A crosses Senkou B): Long-term trend change forming ahead
Objective rules:
Bullish: Price closes above Senkou B.
Bearish: Price closes below Senkou B.
Breakout rule: Price closes across a flat Senkou B that held for 15+ bars, trade in the break’s direction
Support trade: In an uptrend, buy the first test of a flat Senkou B below price, stop just beyond it
Big picture filter: Take long trades from other tools only when price is above Senkou B
What makes it unique:
Its long 52-bar midpoint makes it the most stubborn line in Ichimoku, and its flat stretches act as genuine price magnets. Few indicators create horizontal levels price visibly gravitates toward.
Click here to learn more about the indicator.
The indicator table value in TradePoint & RZone also provides you with a list of all values of this indicator for any group of stocks. This will allow you to compare the readings of this indicator across different stocks.
This indicator is also available in the System Builder of RZone & TradePoint for all charting methods. Using the system builder, you can develop various strategies based on the different conditions already present in this indicator. Additionally, it can be used with other indicators or price patterns to develop effective trading strategies. For any group of stocks and market segments, you can scan and backtest stocks based on those strategies.
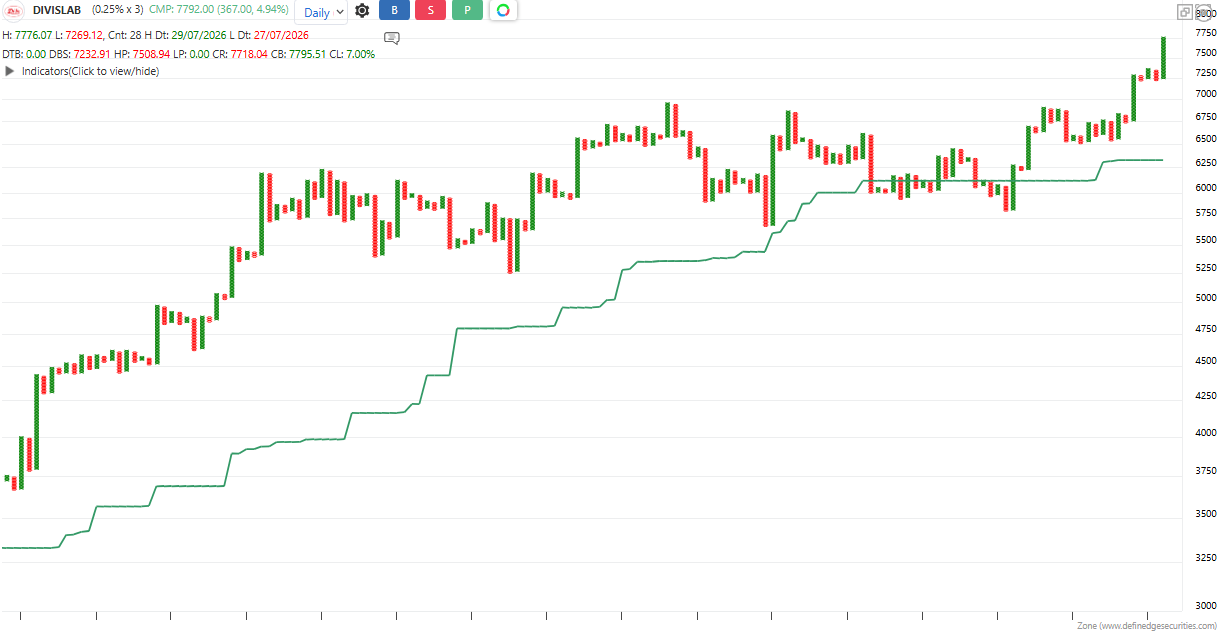
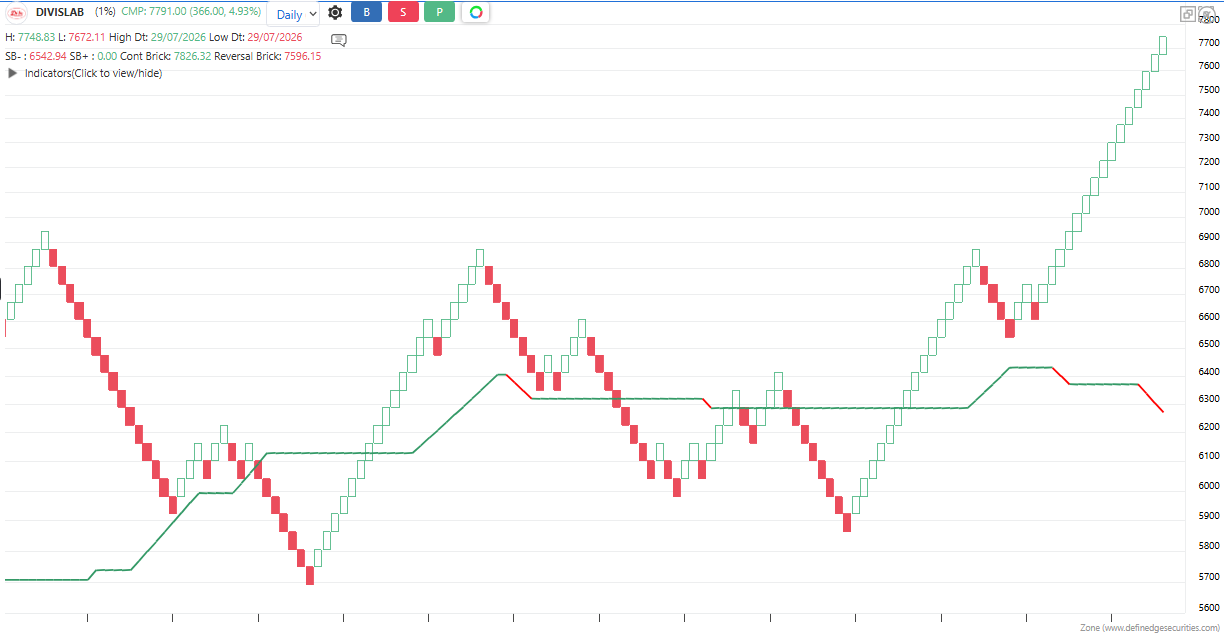
The indicator is applicable to all types of charting. Calculated based on the number of columns on P&F charts, bricks on Renko charts, lines on Line-break charts, candles on Heikin ashi charts, and lines on Kagi charts. While the formula and reading of the indicators remain the same, they become more dynamic on these charts.