Customer Support : 020-61923200, [email protected] | Call and Trade : 020-61923220

Ratio Rank Indicator
#relative-strength #rank #consistency #comparison
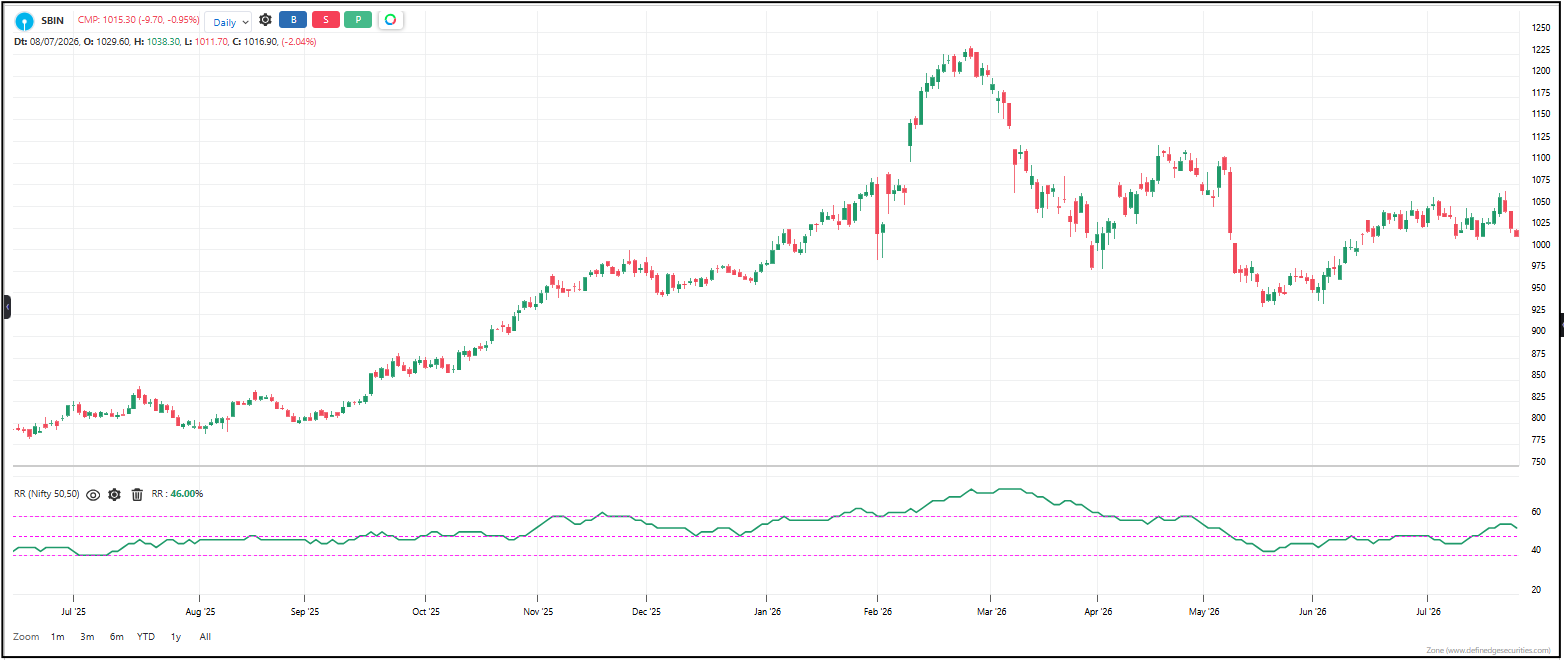
Ratio Rank Indicator measures how consistently one asset outperforms another over a rolling window. It compares the numerator asset against the denominator asset, then counts how many days the numerator closed higher over a 50-period window. That count is then normalized into a smooth reading. The result tells you not just whether the numerator is stronger, but whether that strength is consistent or sporadic.
Default period: 50
Line behavior: The line moves up when the numerator is advancing on most days relative to the denominator — meaning consistent outperformance. It moves down when the numerator is failing to advance — meaning consistent underperformance. Higher values mean the numerator is winning more often. Lower values mean it’s losing more often.
Useful readings:
– Line rising — the numerator is becoming more consistent at outperforming the denominator. Relative strength is building.
– Line falling — the numerator is becoming more consistent at underperforming the denominator. Relative strength is eroding.
– High readings — the numerator is winning the vast majority of days. Very strong relative consistency.
– Low readings — the numerator is losing the vast majority of days. Very weak relative consistency.
– Mid-range readings — both assets are trading evenly. No clear leader.
– Extreme highs after a long rise — the numerator may be overextended relative to the denominator. A rotation could be coming.
– Extreme lows after a long fall — the numerator may be oversold relative to the denominator. A bounce could be coming.
Objective rules:
– Go long the numerator when the Rank line rises above the mid-range and keeps climbing — consistency is on its side.
– Go short the numerator when the Rank line falls below the mid-range and keeps dropping — consistency is against it.
– Exit when the Rank line reverses direction and crosses back through the mid-range.
– Strongest signals come at the extremes — very high or very low readings mean the relationship is clearly defined.
– Avoid trading when the line is stuck in the middle — neither asset has consistent dominance.
– Use this to screen for the strongest assets in a portfolio — the ones with the highest Ratio Rank are the most reliable leaders.
What makes it unique: A regular ratio chart tells you if one asset is stronger right now. The Ratio Rank tells you if that strength is sustainable. An asset can be above another today but lose tomorrow — that’s noise. This indicator filters out the noise by measuring consistency over 50 days. It answers the question: “Is this asset truly leading, or just having a good week?”
By selecting the RS indicator scanner in the RS scanner menu in RZone and TradePoint, you can also scan the ratio rank indicator. This will enable you to compare the readings of all stocks on ratio rank and relative strength alpha.
Click here to learn more about the indicator and the relative strength analysis.