Customer Support : 020-61923200, [email protected] | Call and Trade : 020-61923220
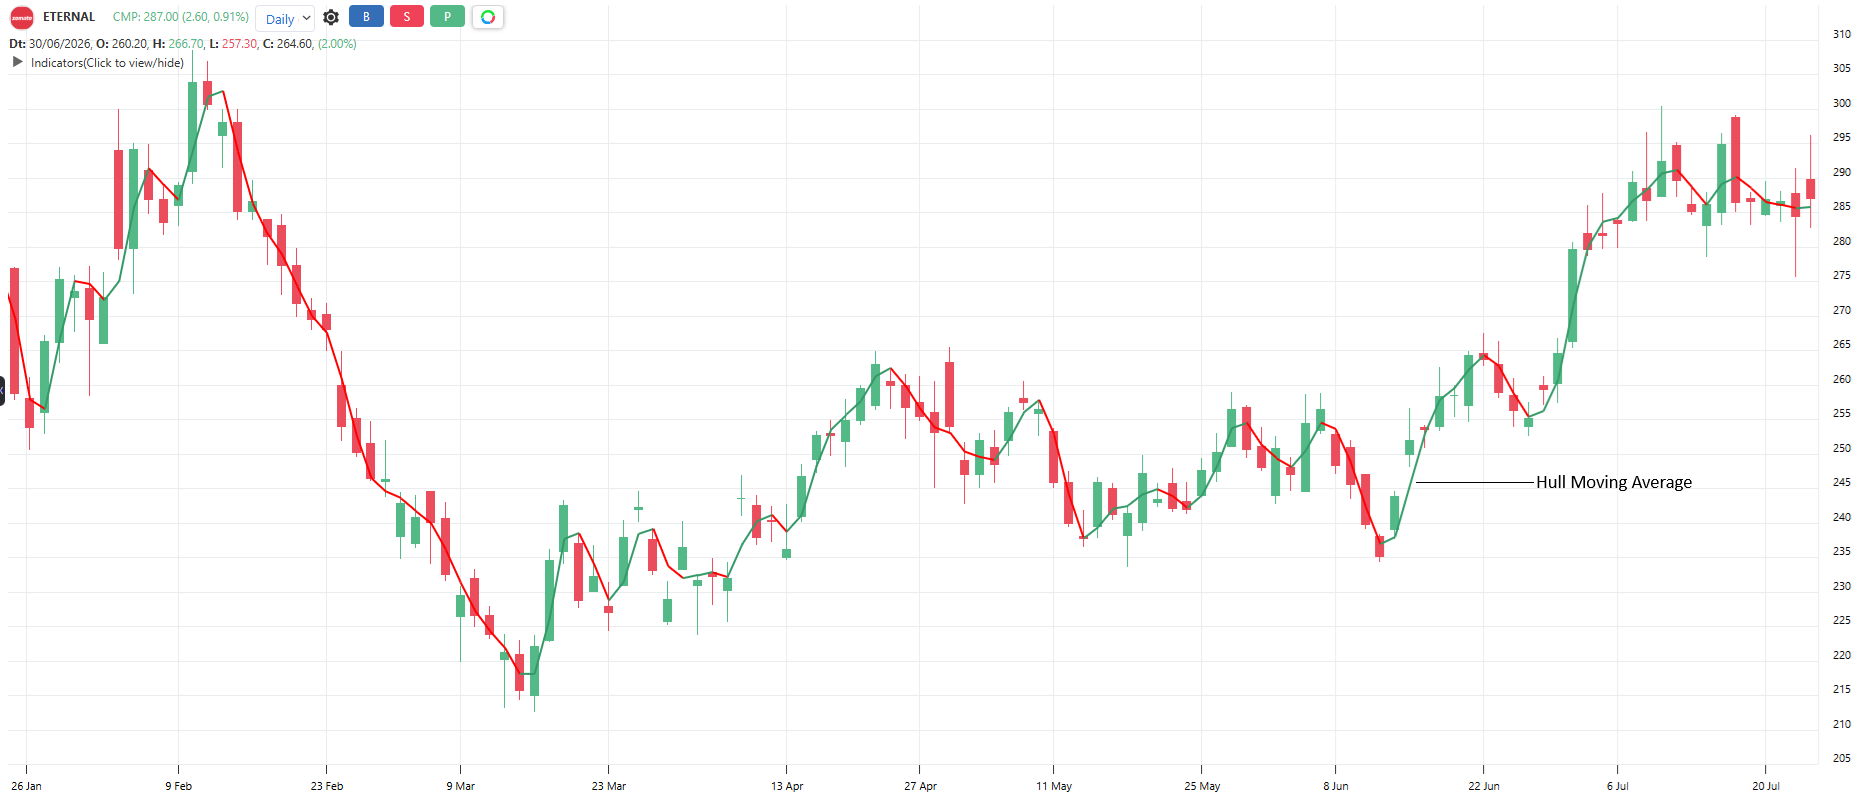
Hull Moving Average
#trendfollowing #movingaverage #lowlag
Creator : Alan Hull
A moving average built to be both smooth and fast, nearly removing the usual lag. It combines weighted moving averages of the period and half the period, then smooths the result with the square root of the period. It hugs price tightly yet stays smooth, so its slope changes are easy to read.
Default period: 5
Rising HMA indicates uptrend. Falling HMA indicates downtrend. Its turns come earlier than normal moving averages.
Useful readings:
HMA turns up: Early uptrend signal
HMA turns down: Early downtrend signal
Price above rising HMA: Trend up and clean
HMA slope steepening: Trend accelerating
HMA flattening: Move stalling, tighten stops
In sideways markets its early turns become false signals, use a chop filter
Objective rules:
Bullish: HMA turns up (current value higher than previous bar’s value).
Bearish: HMA turns down (current value lower than previous bar’s value).
Confirmation filter: Take the turn signal only if price also closes on the same side of the HMA
Long exit: HMA turns down
Chop filter: Skip signals if HMA changed direction more than twice in last 10 bars
What makes it unique:
It solved the oldest moving average trade-off: it is both smoother and faster than the averages it is built from. Its square-root-period smoothing trick remains unmatched for readable slope.
The indicator table value in TradePoint & RZone also provides you with a list of all values of this indicator for any group of stocks. This will allow you to compare the readings of this indicator across different stocks.
This indicator is also available in the System Builder on RZone & TradePoint for all charting methods. Using the system builder, you can develop various strategies based on the different conditions already present in this indicator. Additionally, it can be used with other indicators or price patterns to develop effective trading strategies. For any group of stocks and market segments, you can scan and backtest stocks based on those strategies.
The indicator is applicable to all types of charting. It is calculated based on the number of columns on P&F charts, bricks on Renko charts, lines on Line-break charts, candles on Heikin-Ashi charts, and lines on Kagi charts. While the formula and reading of the indicators remain the same, they become more dynamic on these charts.