Customer Support : 020-61923200, [email protected] | Call and Trade : 020-61923220

D-Disparity Dots Indicator
#disparity #mean-reversion #moving-average #dots
Creator : Definedge
Default period: 20
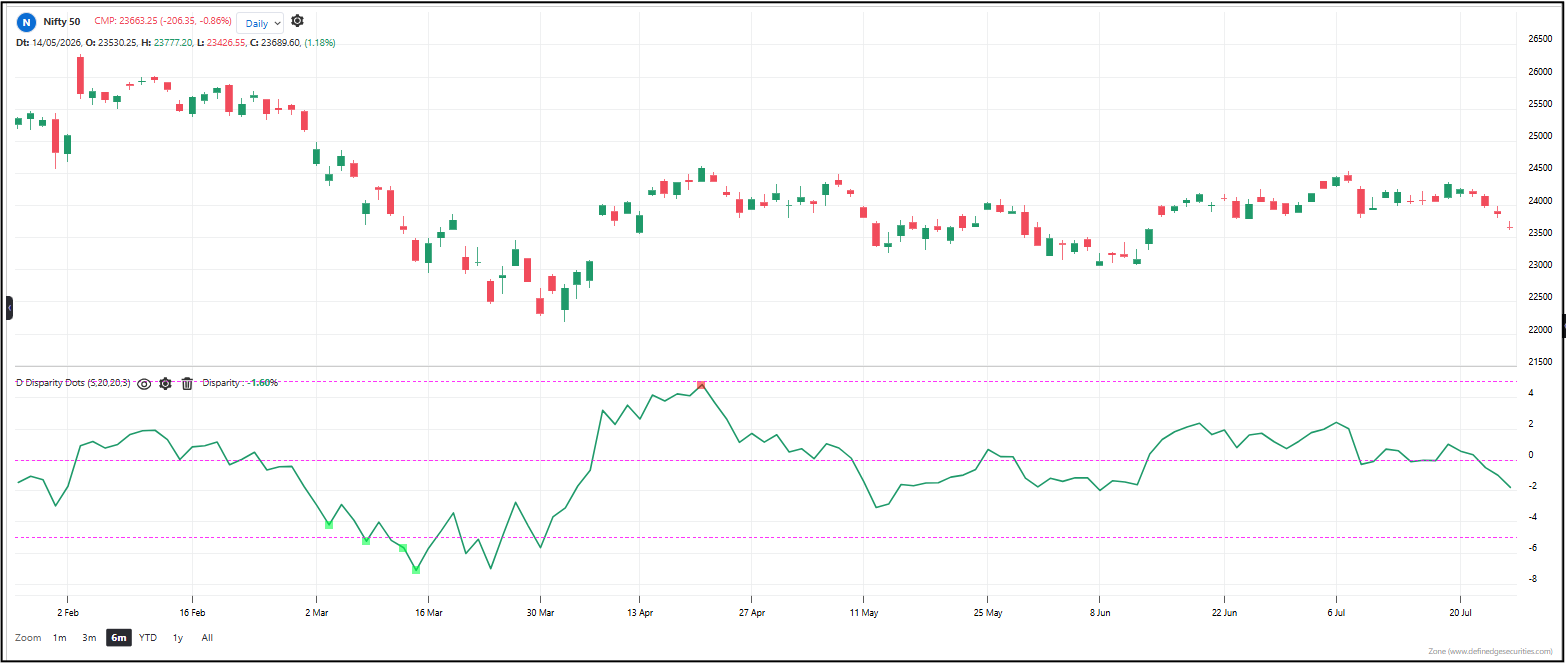
The Disparity Index introduced by Steve Nisson measures the distance between the latest closing price of a security and the moving average. The disparity index value is presented as a percentage. When the disparity index exceeds the zero line, it means that the price of the scrip has closed above the moving average. The disparity index is below the zero line if the price of the stock has closed below the moving average.
An increasing disparity is bullish because it indicates a strong price trend. Similarly, a falling disparity line indicates a bearish trend.
A higher disparity reading indicates that the bulls have exhausted themselves, whereas a lower disparity reading indicates that the bears have exhausted themselves.
How to read it:
A line that shows how stretched price is from its moving average. When the line spikes up and a Red Dot appears, price has run too far above average — expect a pullback. When the line spikes down and a Green Dot appears, price has dropped too far below average — expect a bounce. No dot means price is behaving normally.
Useful readings:
– Red Dot — price is at a short-term extreme above average. The rubber band is stretched. Pullback incoming.
– Green Dot — price is at a short-term extreme below average. Oversold relative to average. Bounce incoming.
– No dot — price is within normal range. Nothing extreme happening.
– Multiple red dots in a row at higher levels — the average is rising with price. The trend is strong, not overextended.
– Multiple green dots in a row at lower levels — the average is falling with price. The downtrend is strong, not oversold.
Use cases:
– Mean reversion entries: Green dot + price below average = buy the bounce. Red dot + price above average = sell the pullback.
– Trend health check: If dots keep appearing but at progressively higher (or lower) levels, the trend is healthy. If dots appear and price fails to make new extremes, the trend is dying.
– Trend-following exits: A red dot at the top of an uptrend is often the last gasp. That’s when you tighten stops or take profit.
– Works everywhere: Candlestick, Renko, Point & Figure, Kagi — it adapts to any chart type.
Objective rules:
– Buy when a Green Dot appears and price is below the moving average.
– Sell when a Red Dot appears and price is above the moving average.
– Exit when price crosses back through the moving average.
– Skip signals when there’s no dot — price isn’t stretched enough to warrant a mean-reversion trade.
What makes it unique: Most overbought/oversold tools use fixed levels (RSI 70/30, Stochastic 80/20). This one adapts to the market’s actual behavior. In a volatile market, it raises the bar. In a quiet market, it tightens. The dots give you a visual signal you can’t miss — no line-crossing interpretation needed. It’s mean reversion with built-in context.
Click here to know more about disparity index.
The concept is explained in detail in this video.
The indicator table value in TradePoint & RZone also provides you with a list of all values of this indicator for any group of stocks. This will allow you to compare the readings of this indicator across different stocks.
This indicator is available in the System Builder on RZone & TradePoint for all charting methods. Using the system builder, you can develop various strategies based on the different conditions already present in this indicator. Additionally, it can be used with other indicators or price patterns to develop effective trading strategies. For any group of stocks and market segments, you can scan and backtest stocks based on those strategies.
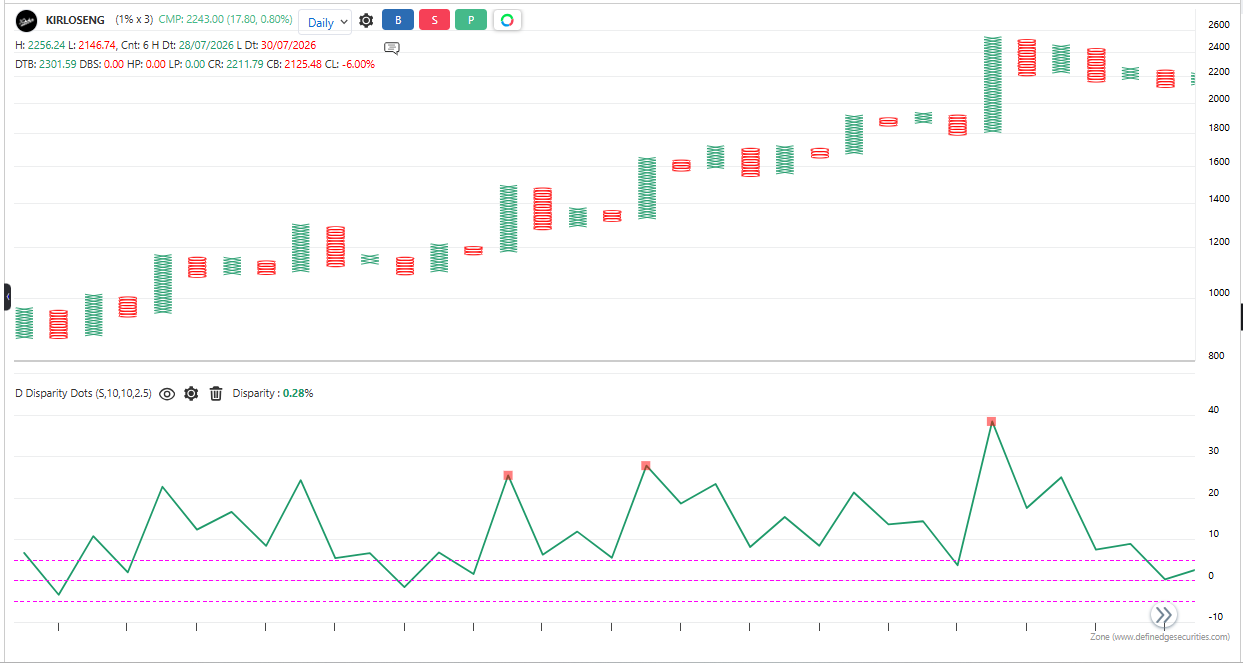
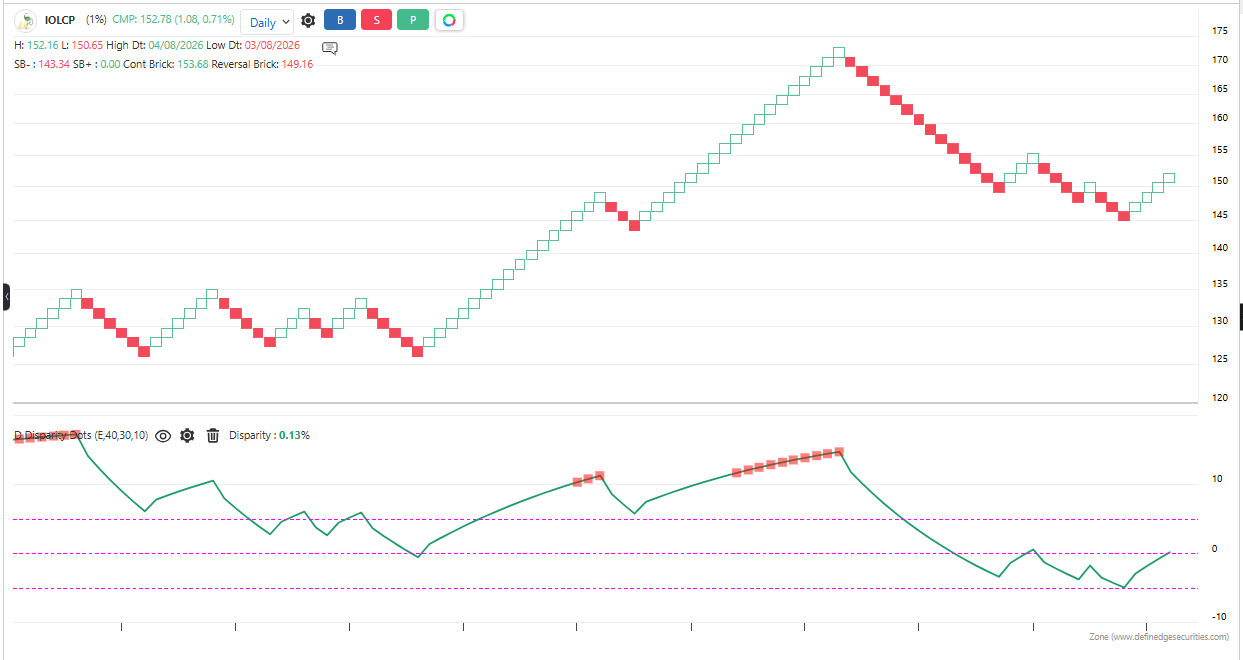
The indicator is applicable to all types of charting. It is calculated based on the number of columns on P&F charts, bricks on Renko charts, lines on Line-break charts, candles on Heikin-Ashi charts, and lines on Kagi charts. While the formula and reading of the indicators remain the same, they become more dynamic on these charts.