Customer Support : 020-61923200, [email protected] | Call and Trade : 020-61923220

Percent Away From MA
#mean-reversion #moving-average #stretch #deviation
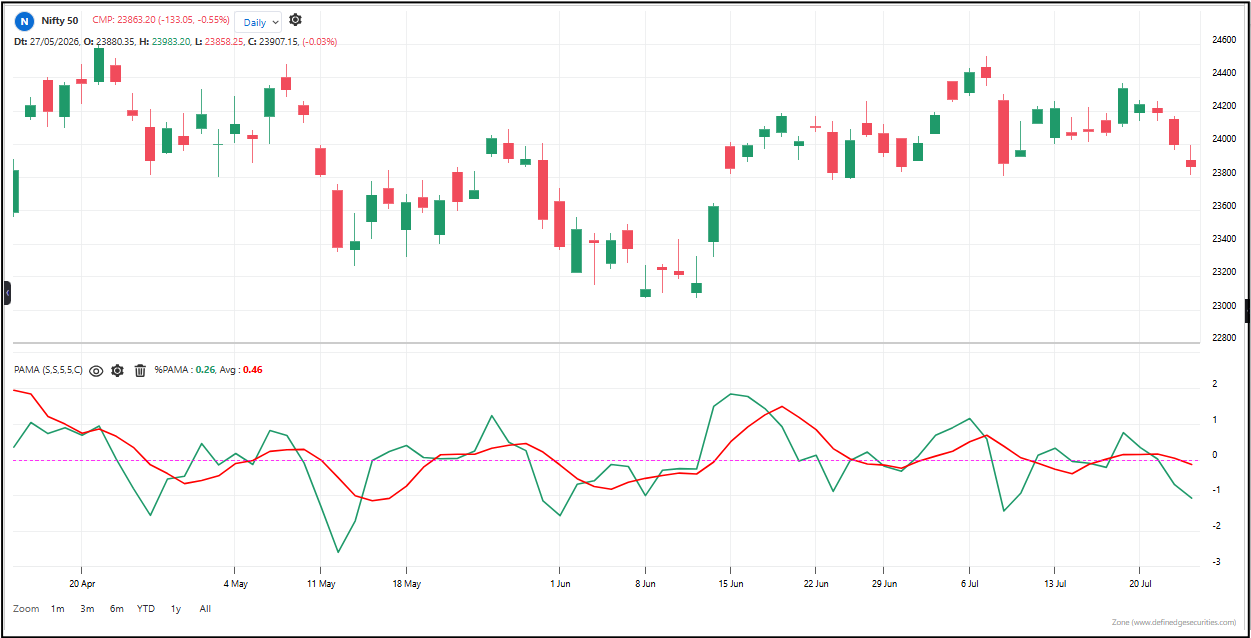
Percent Away from MA tells you exactly how far price is from its moving average — expressed as a clean percentage. Above zero means price is above average. Below zero means price is below average. The further from zero, the more stretched price is from its normal level.
Default period: 5
How to read it:
A single line that oscillates around zero. Positive readings mean price is above the moving average. Negative readings mean price is below. The magnitude tells you how extreme the stretch is. A reading of +5% means price is 5% above average. A reading of -5% means price is 5% below average. The line is smooth and easy to read — no confusing scales or hidden thresholds.
Useful readings:
– Positive and rising — price is moving further above average. The uptrend is accelerating.
– Positive and falling — price is pulling back toward average from above. The stretch is healing.
– Negative and falling — price is moving further below average. The downtrend is accelerating.
– Negative and rising — price is bouncing back toward average from below. The stretch is healing.
– Extreme positive reading — price is very far above average. Overextended. Pullback likely.
– Extreme negative reading — price is very far below average. Oversold. Bounce likely.
– Crossing through zero — price is crossing the moving average. Trend direction may be changing.
Use cases:
– Mean reversion entries: Buy when the reading is extremely negative (price oversold vs average). Sell when extremely positive (price overbought vs average).
– Trend strength gauge: A steadily rising positive reading means the uptrend is strong and price is comfortably above average. A steadily falling negative reading means the downtrend is strong.
– Pullback entries in trends: In an uptrend, wait for the reading to dip toward zero (pullback to average), then buy when it starts rising again.
– Zero-cross filter: Only hold longs when the reading is above zero. Only hold shorts when below zero. Simple trend filter.
Objective rules:
– Go long when the line crosses above zero from below.
– Go short when the line crosses below zero from above.
– For mean reversion: buy at extreme negative readings, sell at extreme positive readings.
– Exit mean reversion trades when the line returns to zero.
– Avoid trading when the line is flat near zero — price is hugging the average with no direction.
What makes it unique: Most indicators that measure distance from average use arbitrary scales or hidden calculations. This one gives you a straight percentage — so you always know exactly how stretched price is. “+3% away from average” means the same thing on every stock, every day. That simplicity makes it easy to set consistent entry and exit rules across your entire portfolio.
The indicator table value in TradePoint & RZone also provides you with a list of all values of this indicator for any group of stocks. This will allow you to compare the readings of this indicator across different stocks.
This indicator is also available in the System Builder of RZone & TradePoint for all charting methods. Using the system builder, you can develop various strategies based on the different conditions already present in this indicator. Additionally, it can be used with other indicators or price patterns to develop effective trading strategies. For any group of stocks and market segments, you can scan and backtest stocks based on those strategies.
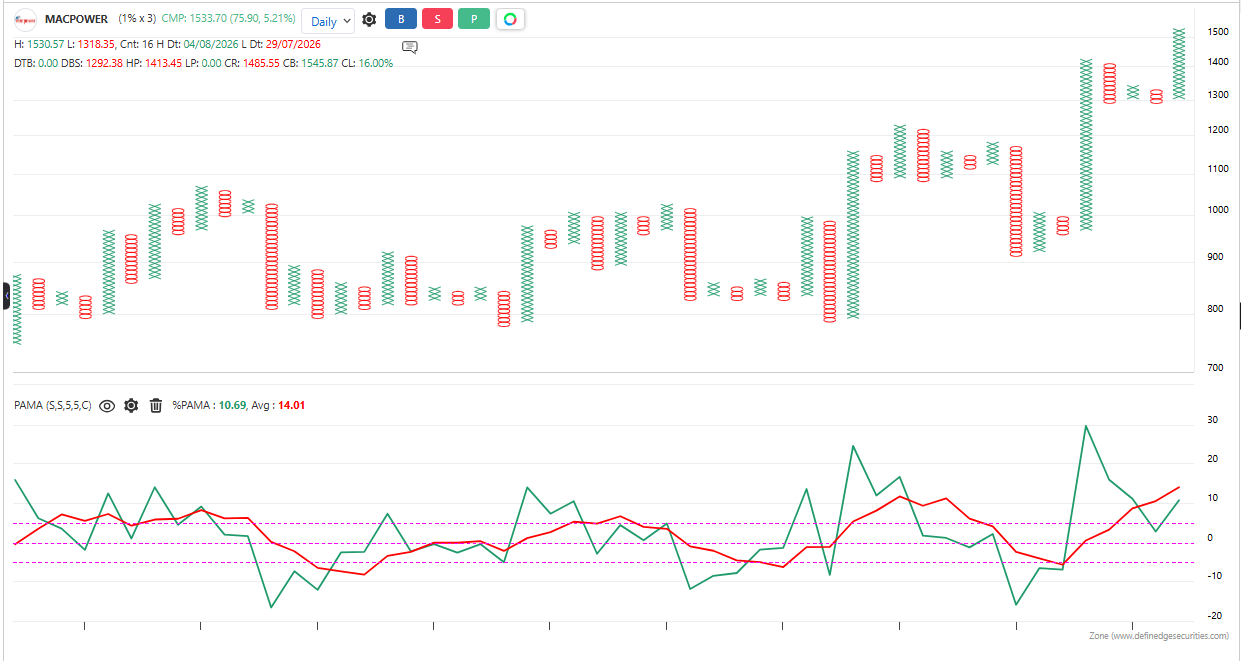
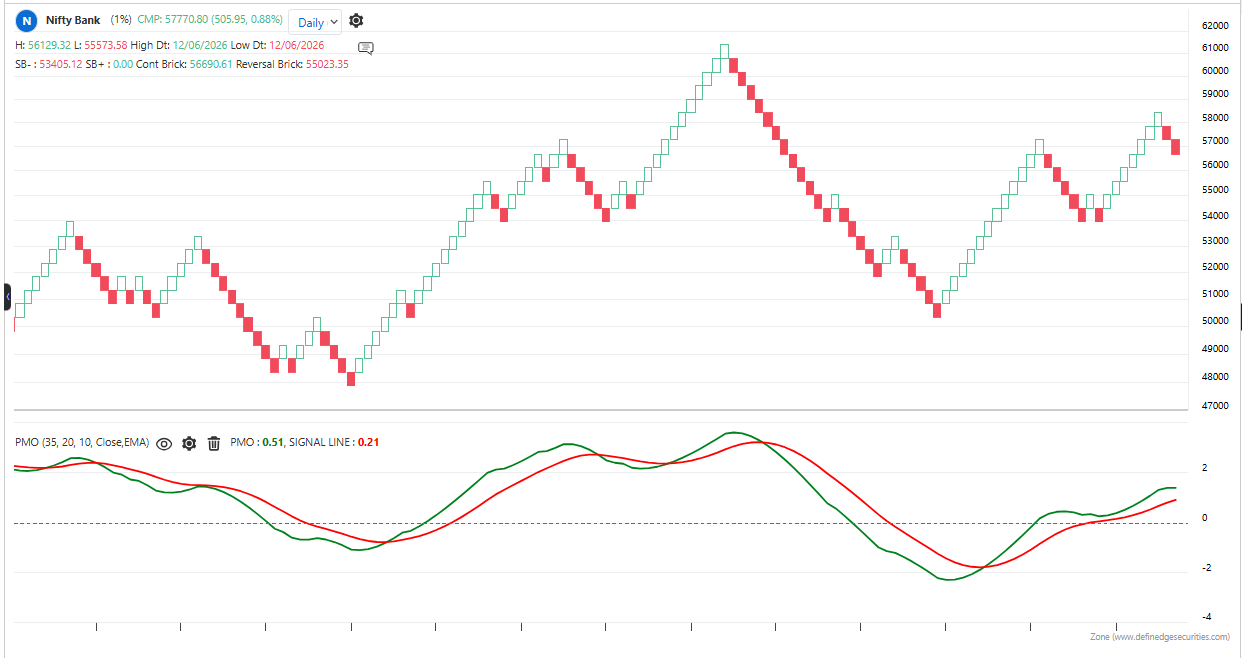
The indicator is applicable to all types of charting. Calculated based on the number of columns on P&F charts, bricks on Renko charts, lines on Line-break charts, candles on Heikin ashi charts, and lines on Kagi charts. While the formula and reading of the indicators remain the same, they become more dynamic on these charts.