Customer Support : 020-61923200, [email protected] | Call and Trade : 020-61923220

AMMA Indicator
#adaptive #moving-average #trend #dynamic
Creator : Definedge
Default period: 50
The AMMA indicator is a combination of Moving Average and Adaptive Moving Average.
There is a difference in the underlying behaviour of the Moving Average and the Adaptive Moving Average. The Adaptive Moving Average considers volatility as part of the Moving Average calculation.
It is often the case that price respects Moving Averages more and that helps with trailing stop-losses or sticking to the trend. Sometimes, an Adaptive Moving Average works well and reduces the whipsaw effect. By plotting both, one can identify strong trends.
How to read it:
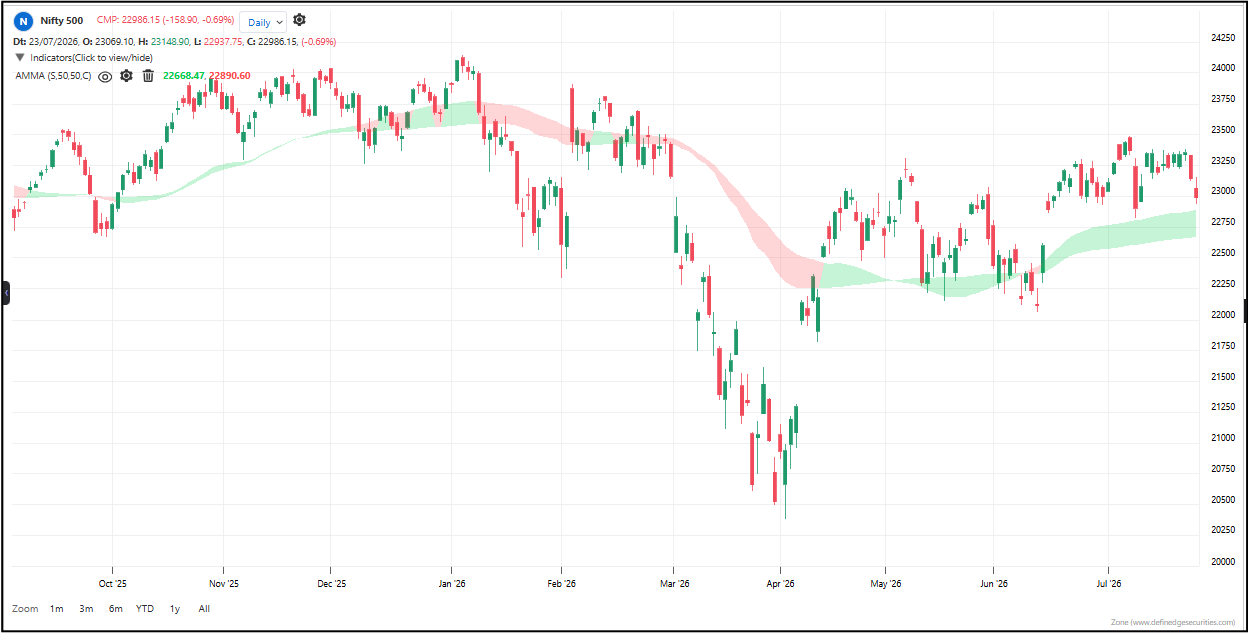
The AMMA line moves faster than a normal MA during trends and smoother during chop. When the AMMA is above the baseline MA, the trend is bullish. When below, it’s bearish. The bands around the AMMA turn bullish-colored when price is above the MA and bearish-colored when price is below — so you always know the trend direction at a glance.
Useful readings:
– AMMA above MA — bullish trend. The adaptive average has confirmed upward momentum.
– AMMA below MA — bearish trend. The adaptive average has confirmed downward momentum.
– AMMA rising sharply — the market is trending strongly and the AMMA is accelerating to keep up.
– AMMA flattening — the market is going choppy and the AMMA is slowing down to avoid whipsaws.
– Bullish-colored bands — price is above the MA. The trend is confirmed bullish.
– Bearish-colored bands — price is below the MA. The trend is confirmed bearish.
– AMMA crosses above MA — momentum has shifted from bearish to bullish.
– AMMA crosses below MA — momentum has shifted from bullish to bearish.
Use cases:
– Trend following with less lag: The AMMA catches trends faster than a regular MA because it speeds up when momentum builds. You get in earlier and stay in longer.
– Whipsaw protection: During chop, the AMMA slows down and flattens — so it doesn’t throw false signals. Regular MAs keep crossing price and generating bad signals in chop. The AMMA doesn’t.
– Visual trend confirmation: The colored bands give you an instant read on trend direction. Bullish color = go long. Bearish color = go short. No interpretation needed.
– Multi-chart use: Works on all chart types — candlestick, Renko, Point & Figure, Kagi, Heikin Ashi.
Objective rules:
– Go long when AMMA crosses above the MA and bands turn bullish.
– Go short when AMMA crosses below the MA and bands turn bearish.
– Exit when the AMMA crosses back through the MA.
– Avoid trading when the AMMA is flat and hugging the MA — the market is choppy.
– Use the band color as a filter: only trade in the direction of the band color.
What makes it unique: A regular moving average is like a car stuck in one gear — it’s either too slow in trends or too fast in chop. The AMMA is like a car with automatic transmission — it shifts gears based on road conditions. That’s why it catches trends earlier, stays smoother in chop, and gives you cleaner signals than any fixed-period MA.
Prashant Shah introduced this concept in his book on Relative Strength, which is available for free on Shelf.
The indicator table value in TradePoint & RZone also provides you with a list of all values of this indicator for any group of stocks. This will allow you to compare the readings of this indicator across different stocks.
This indicator is available in the System Builder on RZone & TradePoint for all charting methods. Using the system builder, you can develop various strategies based on the different conditions already present in this indicator. Additionally, it can be used with other indicators or price patterns to develop effective trading strategies. For any group of stocks and market segments, you can scan and backtest stocks based on those strategies.
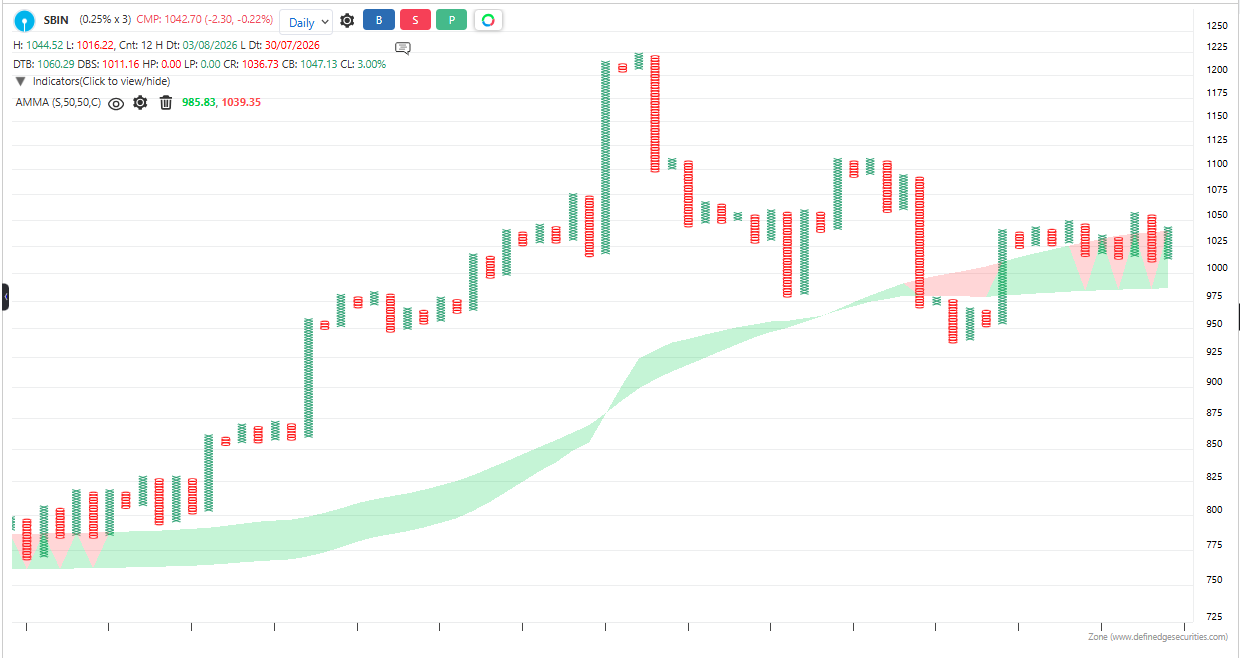
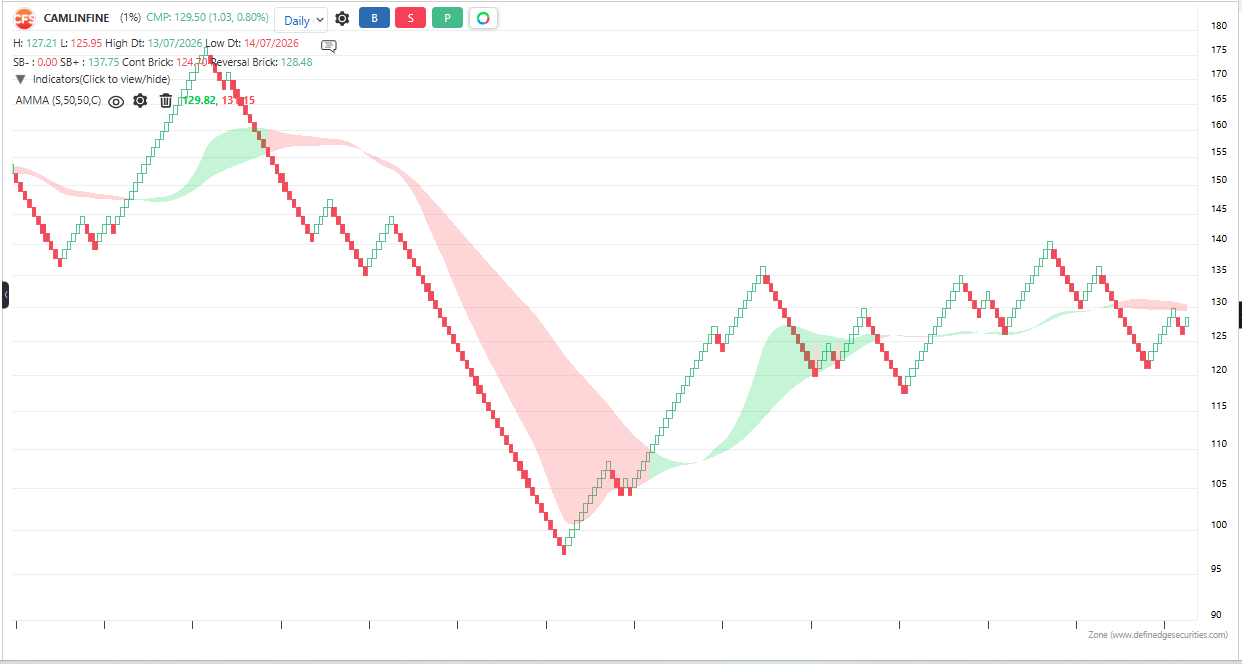
The indicator is applicable to all types of charting. It is calculated based on the number of columns on P&F charts, bricks on Renko charts, lines on Line-break charts, candles on Heikin-Ashi charts, and lines on Kagi charts. While the formula and reading of the indicators remain the same, they become more dynamic on these charts.