Customer Support : 020-61923200, [email protected] | Call and Trade : 020-61923220

Typical Price – Average
#movingaverage #trendfollowing
Inventor:
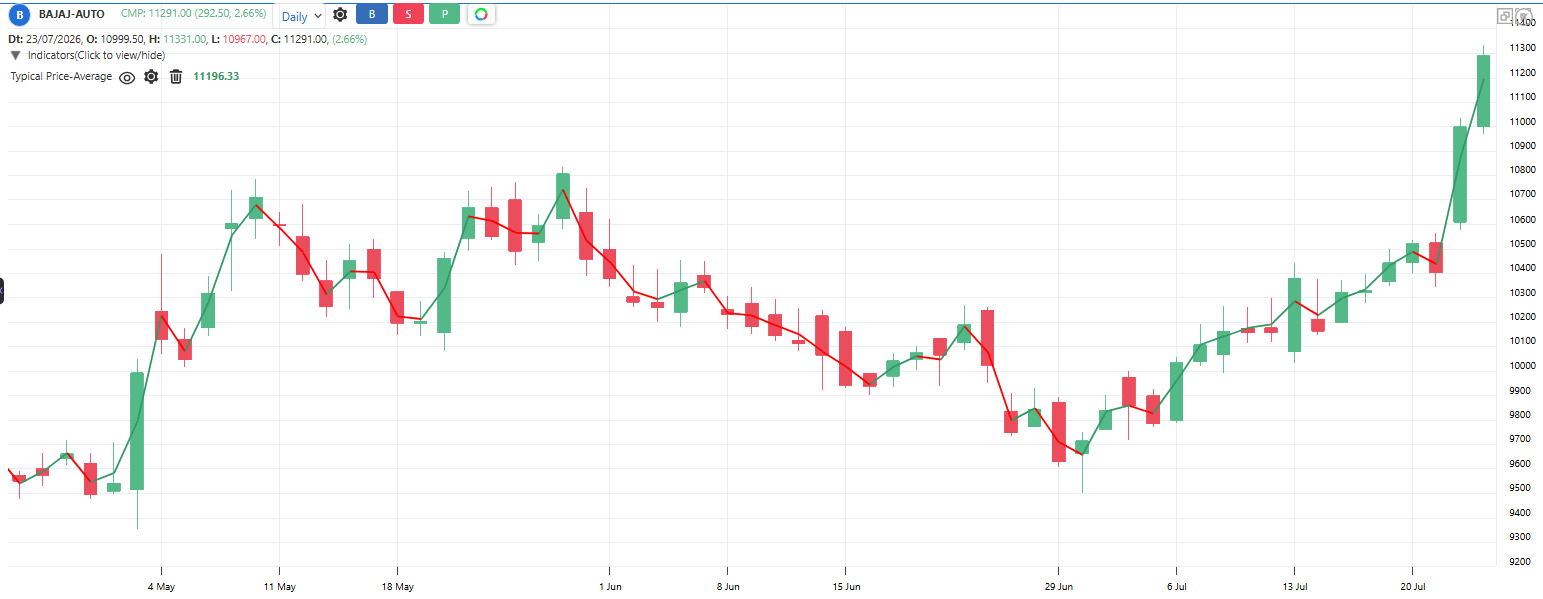
A moving average calculated on the Typical Price of each bar – (High + Low + Close) / 3 – instead of just the close. The typical price represents the whole bar’s business, not only its final tick, so the average is slightly steadier and harder to distort with a single closing spike. Used exactly like a normal moving average.
Default period: 20
Rising average indicates uptrend. Falling average indicates downtrend.
Reads the same as a normal moving average, with slightly calmer behavior on spike closes.
Useful readings:
Price above rising average: Uptrend in progress
Price below falling average: Downtrend in progress
A wild close that a normal MA reacts to barely moves this one: fewer fake crosses
Average flat: Sideways market, ignore crosses
Also the base of other tools: MFI and CCI are built on typical price
Useful on stocks that often close with manipulated or spiky final prints
Objective rules:
Bullish: Price closes above the typical price average AND the average is rising.
Bearish: Price closes below the typical price average AND the average is falling.
Long exit: Two consecutive closes below the average
Flat filter: Skip signals when the average has moved less than 1% in 20 bars
What makes it unique:
It averages the whole bar’s business, not just the closing tick, making it resistant to end-of-day spikes and manipulation. It is also the quiet foundation under CCI and MFI.
The indicator table value in TradePoint & RZone also provides you with a list of all values of this indicator for any group of stocks. This will allow you to compare the readings of this indicator across different stocks.