Customer Support : 020-61923200, [email protected] | Call and Trade : 020-61923220

Shadow Rate Indicator (SRI)
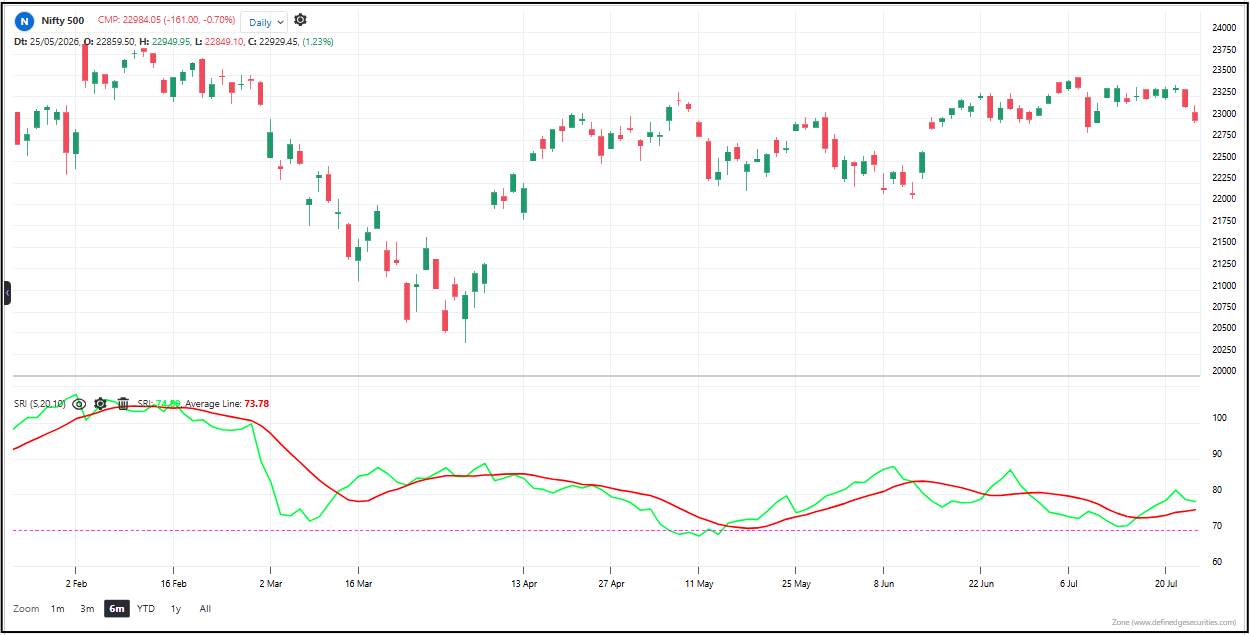
Creator : Definedge
#shadow #candle-structure #conviction #volatility
Shadow Rate Indicator (SRI) tells you whether the market is moving with conviction or hesitation by measuring how much of each candle is made up of shadows (wicks) versus the real body.
Shadow Rate Indicator (SRI) measures how much of each candle’s range comes from shadows (wicks) versus the real body. When shadows dominate, the SRI rises — meaning the market is indecisive and rejecting price moves. When the body dominates, the SRI falls — meaning the market has conviction and is moving with purpose. It’s a gauge of market conviction versus hesitation, derived purely from candle structure.
Default period: 20
How to read it:
A single line with an average line running alongside it. When SRI is high, candles have long shadows — the market is rejecting price moves, struggling to decide direction. When SRI is low, candles have solid bodies — the market knows where it’s going and is moving with purpose. The average line is your baseline: above it means hesitation is rising, below it means conviction is dominant.
Useful readings:
– Above 50 — shadows dominate. The market is indecisive. Trends are weakening. Expect chop or reversal.
– Below 50 — bodies dominate. The market has conviction. Trends are healthy. Expect continuation.
– SRI above its average — hesitation is increasing. The current trend is losing steam.
– SRI below its average — conviction is increasing. The current trend is gaining strength.
– Sharp spike upward — sudden conflict. Buyers and sellers are locked in a fight. Often appears at trend tops or bottoms.
– Sustained low reading — clean, strong trend. The market isn’t arguing with itself.
Use cases:
– Filtering entries: Only take trend-following trades when SRI is below 50. When it’s above 50, the market is indecisive — your trend signals will fail.
– Spotting reversals: A sharp SRI spike at the end of a long trend is a warning sign. The trend is exhausting itself. Prepare to exit.
– Avoiding chop: When SRI is elevated, step aside. The market is range-bound and whipsawing. Don’t fight it.
– Confirming breakouts: A breakout accompanied by low SRI is a real breakout — the market is committed. A breakout with high SRI is likely a fakeout.
Objective rules:
– Only trade trend signals when SRI is below 50.
– Avoid entering when SRI spikes above 50 — the market is indecisive.
– Exit when SRI rises sharply during a trend — conviction is fading.
– Use the average line as a filter: only trade when SRI is on the expected side of its average.
What makes it unique: Almost every indicator measure price, volume, or momentum. The SRI measures something entirely different: candle quality. It answers the question: “Is the market moving with conviction or hesitation?” Two candles can close at the same price but one has a solid body (conviction) and the other has long shadows (indecision). SRI sees the difference. It tells you whether the market is moving with purpose or just arguing with itself. It gives you insight into the health of a trend that no other indicator provides.
The indicator table value in TradePoint & RZone also provides you with a list of all values of this indicator for any group of stocks. This will allow you to compare the readings of this indicator across different stocks.
The indicator is applicable to all types of charting. It is calculated based on the number of columns on P&F charts, bricks on Renko charts, lines on Line-break charts, candles on Heikin-Ashi charts, and lines on Kagi charts. While the formula and reading of the indicators remain the same, they become more dynamic on these charts.
This indicator is also available in the System Builder on RZone & TradePoint for all charting methods. Using the system builder, you can develop various strategies based on the different conditions already present in this indicator. Additionally, it can be used with other indicators or price patterns to develop effective trading strategies. For any group of stocks and market segments, you can scan and backtest stocks based on those strategies.