Customer Support : 020-61923200, [email protected] | Call and Trade : 020-61923220

Price Strength Index
#momentum #oscillator #overbought-oversold #rsi-family #simple
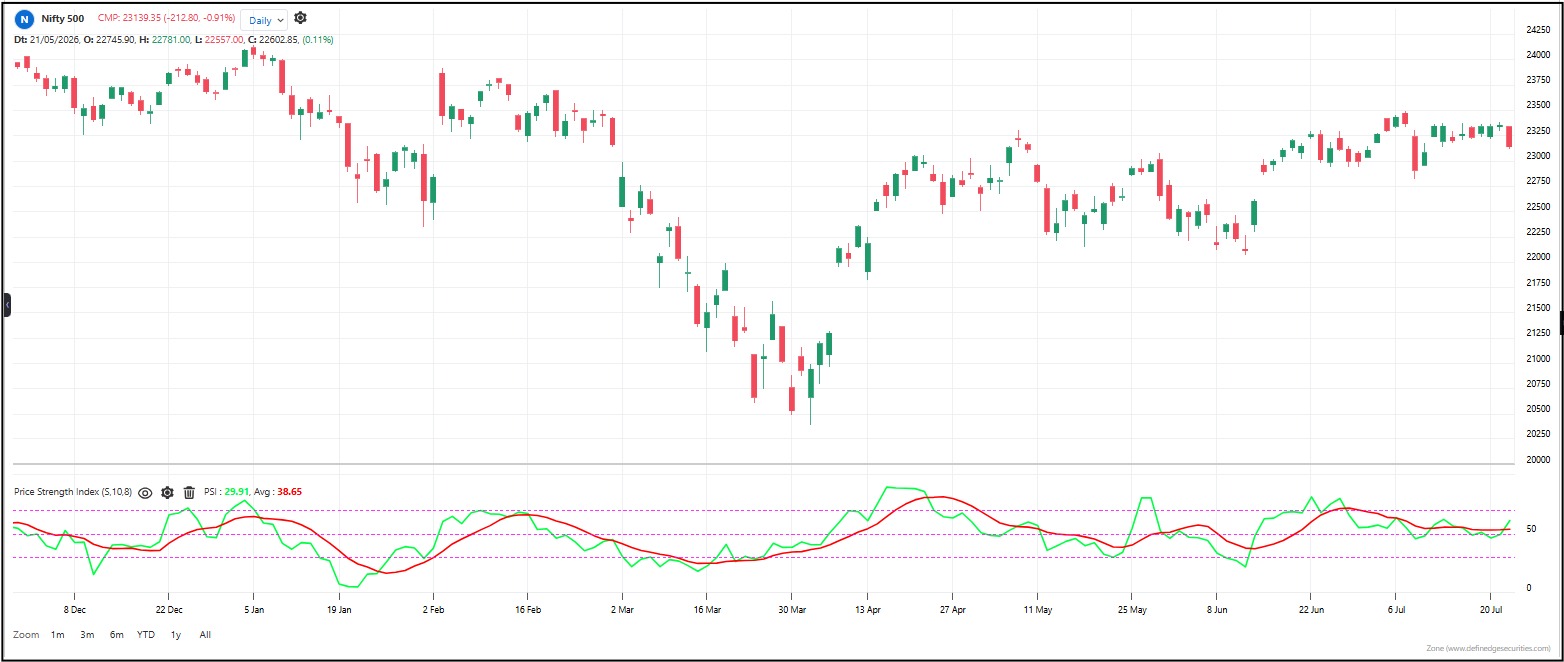
The PSI measures how much of recent price movement has been positive versus negative. It separates each day’s price change into either a gain or a loss, then sums the gains and losses over a rolling window. The final reading is the percentage of total movement that was upward. A reading above 50 means more of the recent movement was bullish; below 50 means more was bearish. It works very much like an RSI but with a simpler, more intuitive calculation.
Default period: 10
Line behavior:
Oscillates between 0 and 100 with 50 as the neutral centerline. When the PSI is above 50, upward price changes have dominated the lookback period. When below 50, downward changes have dominated. A smoothed average line runs alongside the PSI to help identify the broader momentum trend. Key reference levels are 70 (overbought), 50 (neutral), and 30 (oversold).
Useful readings:
– Above 50: Bullish momentum — more of recent movement was upward
– Below 50: Bearish momentum — more of recent movement was downward
– Above 70: Overbought — upward movement has been dominant; pullback possible
– Below 30: Oversold — downward movement has been dominant; bounce possible
– Crossing 50 up/down: Shift in momentum balance
– PSI diverging from price: Momentum is not confirming price action — warning sign
Objective rules:
– Buy when PSI crosses above 50 from below
– Sell when PSI crosses below 50 from above
– Avoid buying when PSI is above 70 (overbought)
– Avoid selling when PSI is below 30 (oversold)
– Use the average line to confirm the overall momentum direction
– All standard RSI-style conditions apply (divergence, failure swings, trend confirmation)
What makes it unique:
The PSI is essentially an RSI built with a plain rolling sum instead of a smoothed average. This makes it slightly more responsive to recent price changes and easier to understand conceptually — you’re literally seeing what percentage of recent movement was positive. It’s a clean, no-frills momentum oscillator that works well on all timeframes.
The indicator table value in TradePoint & RZone also provides you with a list of all values of this indicator for any group of stocks. This will allow you to compare the readings of this indicator across different stocks.
This indicator is also available in the System Builder of RZone & TradePoint for all charting methods. Using the system builder, you can develop various strategies based on the different conditions already present in this indicator. Additionally, it can be used with other indicators or price patterns to develop effective trading strategies. For any group of stocks and market segments, you can scan and backtest stocks based on those strategies.
The indicator is applicable to all types of charting. Calculated based on the number of columns on P&F charts, bricks on Renko charts, lines on Line-break charts, candles on Heikin ashi charts, and lines on Kagi charts. While the formula and reading of the indicators remain the same, they become more dynamic on these charts.