Customer Support : 020-61923200, [email protected] | Call and Trade : 020-61923220

High Low Retracement
#range #retracement #breakout #support-resistance
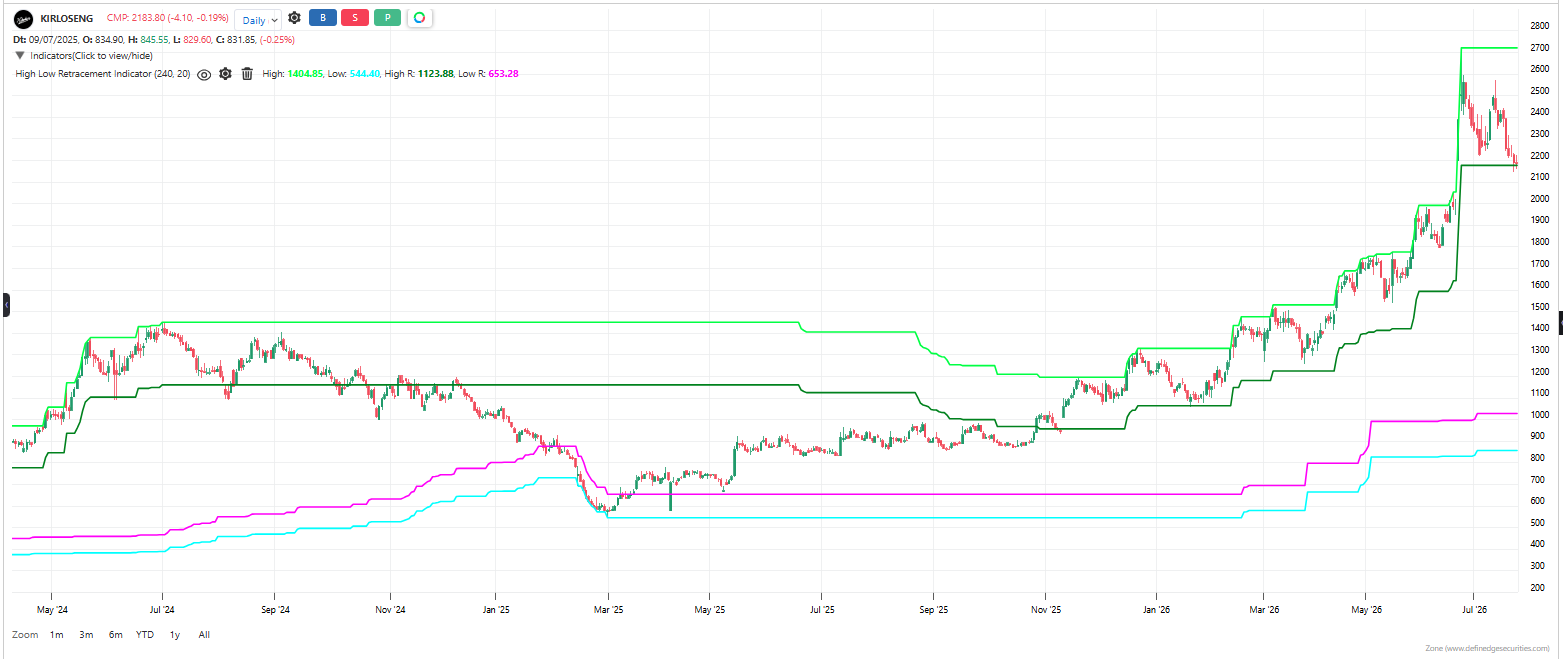
High-Low Retracement Indicator tracks the highest high and lowest low over a rolling period, then draws retracement lines inward from both extremes. These lines mark the zones where price typically pulls back after a strong move. When price stays within the retracement zone, the trend is resting. When price breaks past the high or low boundary, a breakout is confirmed.
Default period: 240, with 20% retracement depth
Line behavior: Four lines are plotted on the chart: High (rolling highest high), Low (rolling lowest low), High R (retracement line pulled back from the high), and Low R (retracement line pulled up from the low). The space between High and High R is the upper retracement zone. The space between Low and Low R is the lower retracement zone.
Useful readings:
– Price between High and High R — the market is pulling back from the highs but still in the upper retracement zone. Bulls are resting, not defeated.
– Price between Low and Low R — the market is bouncing from the lows but still in the lower retracement zone. Bears are resting, not defeated.
– Price above High — bullish breakout confirmed. The market has broken its recent ceiling.
– Price below Low — bearish breakdown confirmed. The market has broken its recent floor.
– Price between High R and Low R — the market is in the middle of its range. No clear retracement or breakout. Consolidation mode.
– Price below High R but above Low R after being near High — the retracement is deep. Bullish control is weakening.
Objective rules:
– Buy on breakout when price closes above the High line.
– Sell on breakdown when price closes below the Low line.
– Buy on pullback when price retraces into the High R zone (between High and High R) and shows rejection of lower prices.
– Sell on rally when price bounces into the Low R zone (between Low and Low R) and shows rejection of higher prices.
– Stay out when price is stuck between High R and Low R — the market has no clear retracement or breakout direction.
– Exit breakout trades if price falls back inside the High line (false breakout) or rises back inside the Low line (false breakdown).
What makes it unique: Most retracement tools use fixed Fibonacci levels or static pivots. This indicator builds retracement zones from live price extremes, so the zones adapt as the market evolves. It combines breakout detection and pullback trading into one indicator.
The indicator table value in TradePoint & RZone also provides you with a list of all values of this indicator for any group of stocks. This will allow you to compare the readings of this indicator across different stocks.
This indicator is also available in the System Builder of RZone & TradePoint for all charting methods. Using the system builder, you can develop various strategies based on the different conditions already present in this indicator. Additionally, it can be used with other indicators or price patterns to develop effective trading strategies. For any group of stocks and market segments, you can scan and backtest stocks based on those strategies.
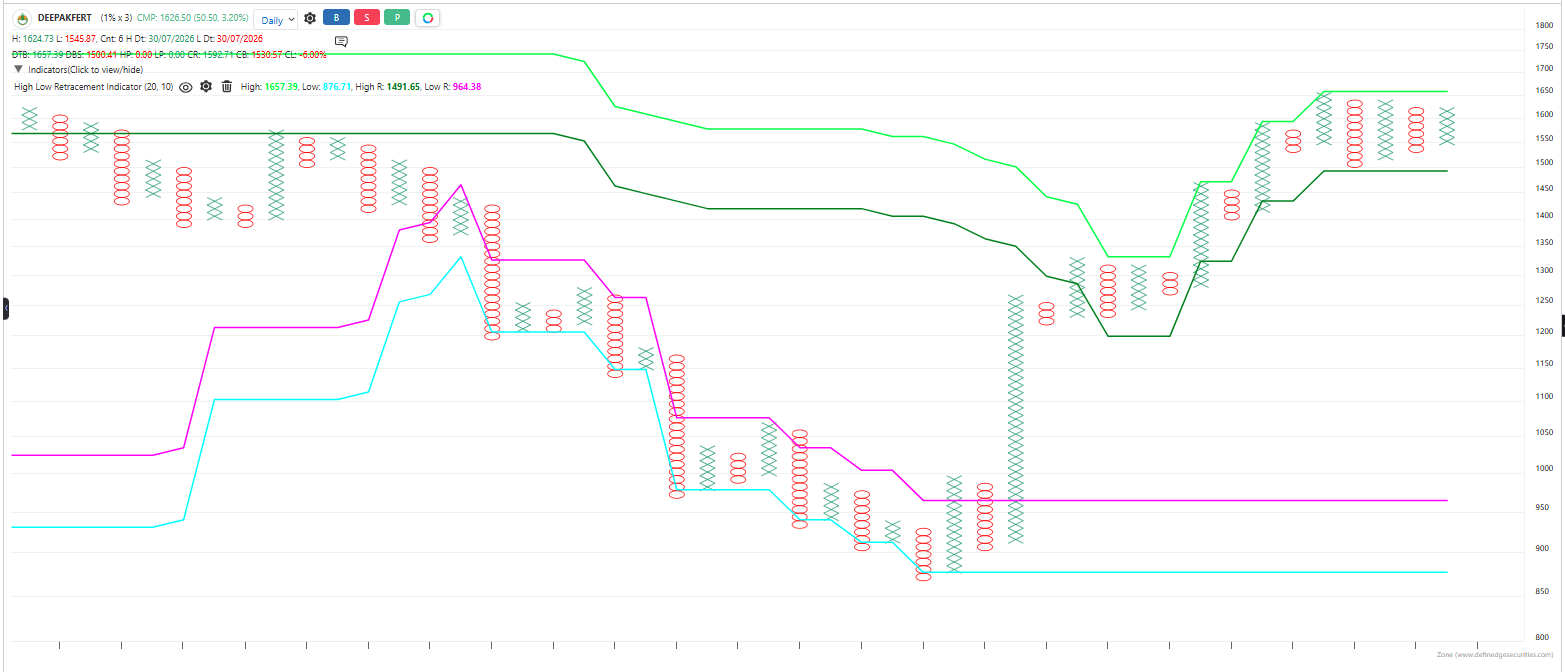
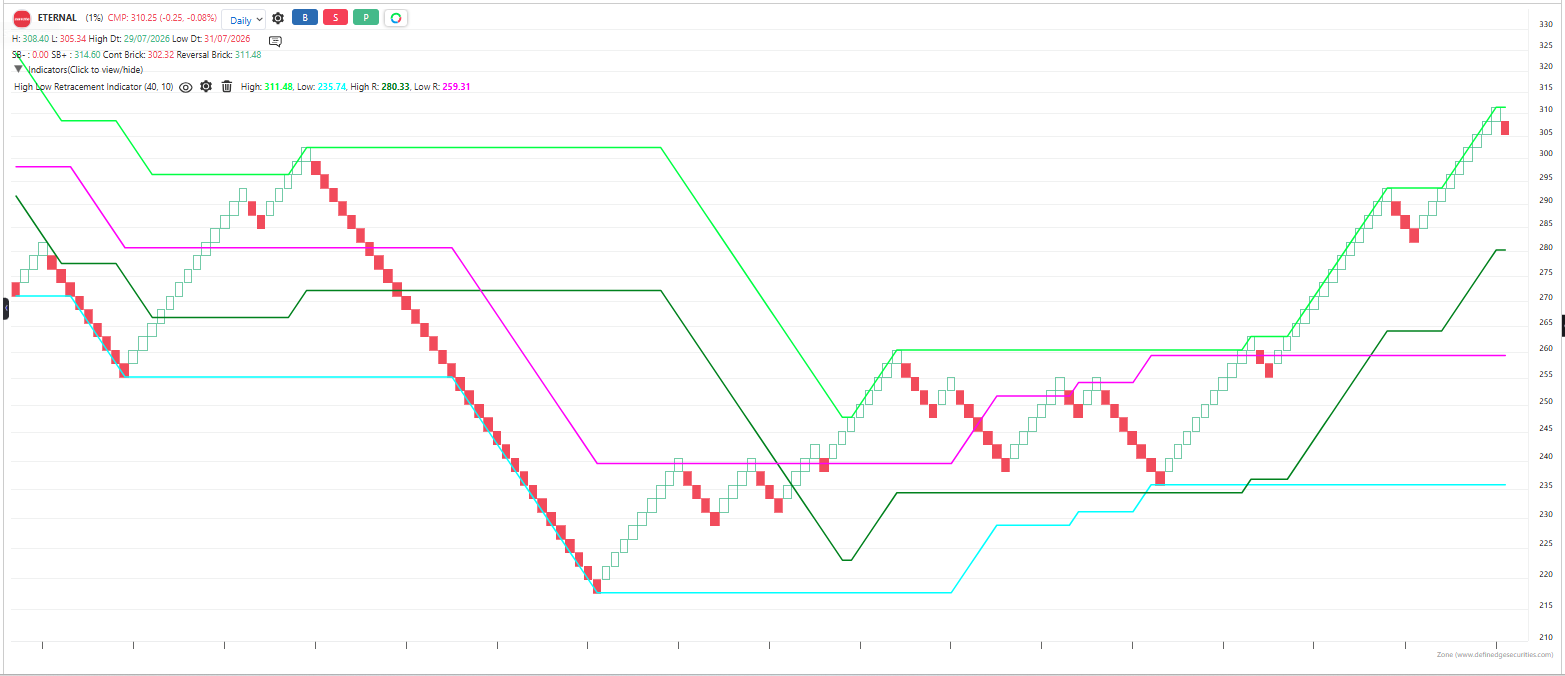
The indicator is applicable to all types of charting. Calculated based on the number of columns on P&F charts, bricks on Renko charts, lines on Line-break charts, candles on Heikin ashi charts, and lines on Kagi charts. While the formula and reading of the indicators remain the same, they become more dynamic on these charts.