Customer Support : 020-61923200, [email protected] | Call and Trade : 020-61923220

Keltner Channel
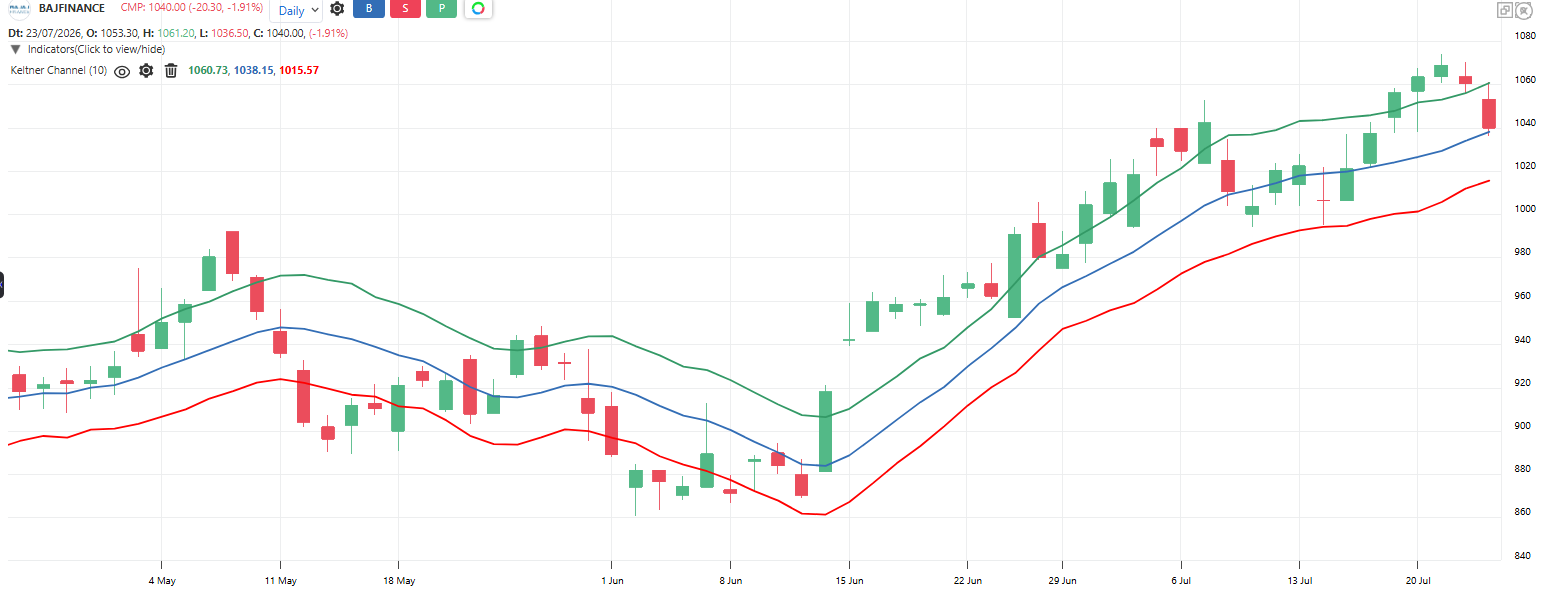
#volatility #channel #breakout
Inventor: Chester W. Keltner
Chester Keltner’s original channel from 1960. The middle line is a moving average of the Typical Price (High + Low + Close) / 3. The bands are drawn one average daily range (High – Low) above and below it. Simple and fast, but because it uses only the day’s range, it ignores overnight gaps. Keltner’s own rule was pure breakout: buy strength above the upper band, sell weakness below the lower band.
Default period: typical price average, range average; Keltner’s original used 10, 10
Price above the upper band indicates unusual strength, breakout. Price below the lower band indicates unusual weakness, breakdown.
Widening bands indicate ranges expanding; narrowing bands indicate a quiet market.
Useful readings:
Close above upper band: Buyers stronger than the recent normal range, bullish breakout
Close below lower band: Sellers stronger than normal, bearish breakdown
Price drifting inside the channel: Normal behavior, no signal
Middle line rising: Trend up, middle line acts as support on dips
Bands very tight: Quiet spell, breakout building
On gap-heavy stocks the bands run too tight and give false breakouts; prefer the ATR version there
Objective rules:
Bullish: Price closes above the upper band.
Bearish: Price closes below the lower band.
Keltner’s original system: Buy the upper band close, stay long until a close below the lower band, then reverse
Long exit (conservative): Price closes below the middle line
Gap filter: On instruments that gap often, use the Keltner ATR version instead
What makes it unique:
It is the original volatility channel, predating Bollinger Bands by two decades, and its native rule was pure breakout. Its range-based bands make it the simplest channel to compute by hand.
Click here to know more about Keltner channel and Keltner ATR bands.
The indicator table value in TradePoint & RZone also provides you with a list of all values of this indicator for any group of stocks. This will allow you to compare the readings of this indicator across different stocks.
This indicator is also available in the System Builder on RZone & TradePoint for all charting methods. Using the system builder, you can develop various strategies based on the different conditions already present in this indicator. Additionally, it can be used with other indicators or price patterns to develop effective trading strategies. For any group of stocks and market segments, you can scan and backtest stocks based on those strategies.
The indicator is applicable to all types of charting. It is calculated based on the number of columns on P&F charts, bricks on Renko charts, lines on Line-break charts, candles on Heikin-Ashi charts, and lines on Kagi charts. While the formula and reading of the indicators remain the same, they become more dynamic on these charts.