Customer Support : 020-61923200, [email protected] | Call and Trade : 020-61923220

Chaikin Volatility
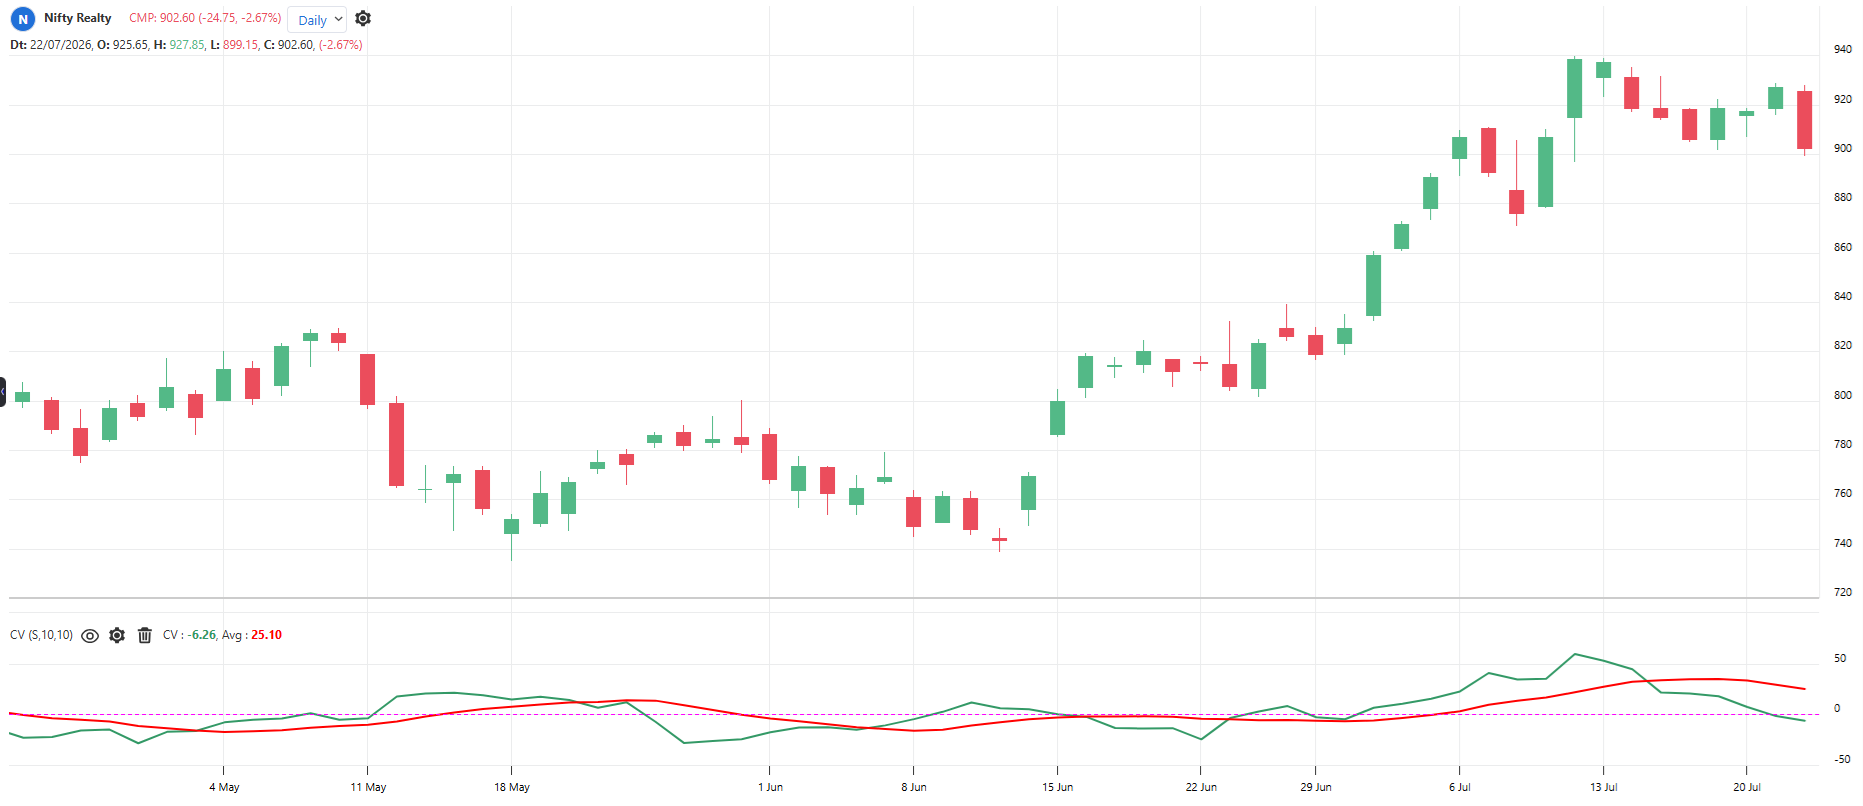
#volatility
Inventor: Marc Chaikin
Measures how fast the daily trading range (High minus Low) is expanding or shrinking. It takes an average of the high-low range and shows its percentage change over a lookback period. Note: it ignores gaps between days, unlike ATR.
Default period: 10, 10 (range average, rate of change)
Rising line indicates ranges are widening, volatility expanding. Falling line indicates ranges are shrinking, volatility contracting.
This indicator does not give direction. Pair it with a trend indicator.
Useful readings:
Sharp rise from low levels: A big move is starting, direction from your trend tool
Sharp spike during a long fall: Panic selling, market bottom often near
Slow steady fall: Market calming down, range trading conditions
Very low and flat for many bars: Quiet market, breakout watch
Rising while price breaks a level: Breakout has power behind it
Falling while price breaks a level: Weak breakout, higher chance of failure
Objective rules:
Expansion: Chaikin Volatility crosses above zero after staying below it.
Contraction: Chaikin Volatility crosses below zero after staying above it.
Breakout confirmation: Take a price breakout only if Chaikin Volatility is rising
Panic bottom rule: Spike to a 6-month high during a decline, watch for reversal with a bullish price signal
Quiet market rule: Reading at multi-month low, prepare breakout orders both sides
What makes it unique:
It isolates the speed of range expansion and contraction, catching the moment volatility itself accelerates. Its signature use is spotting panic-spike bottoms.
The indicator table value in TradePoint & RZone also provides you with a list of all values of this indicator for any group of stocks. This will allow you to compare the readings of this indicator across different stocks.
This indicator is also available in the System Builder of RZone & TradePoint for all charting methods. Using the system builder, you can develop various strategies based on the different conditions already present in this indicator. Additionally, it can be used with other indicators or price patterns to develop effective trading strategies. For any group of stocks and market segments, you can scan and backtest stocks based on those strategies.
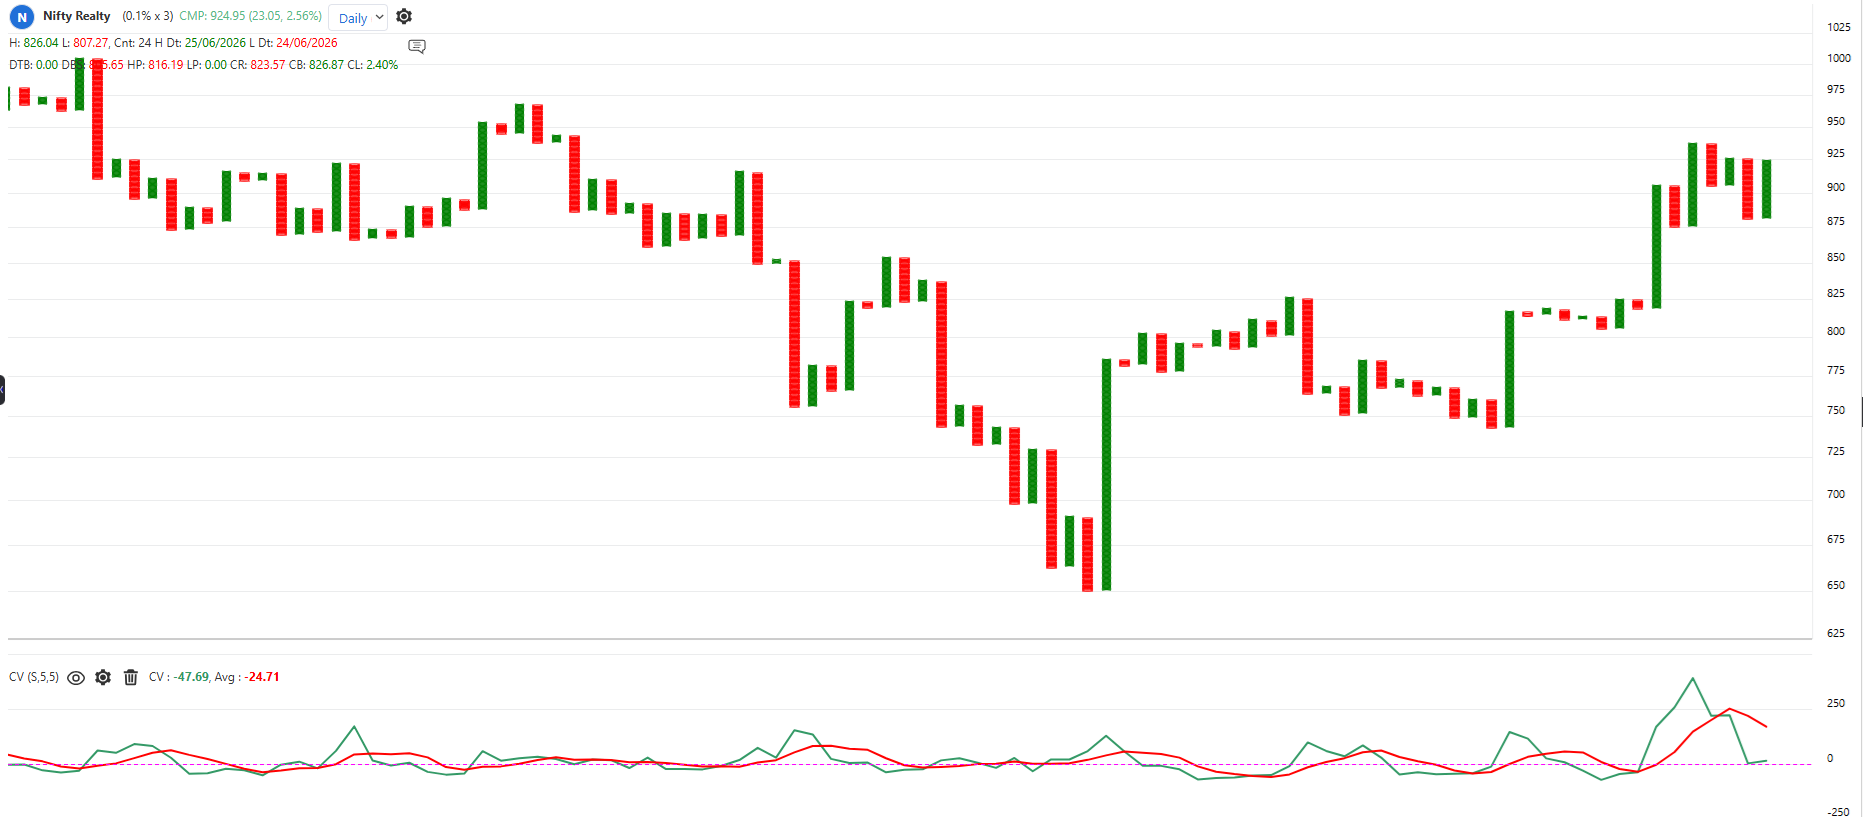 Default period: 5, 5 (range average, rate of change)
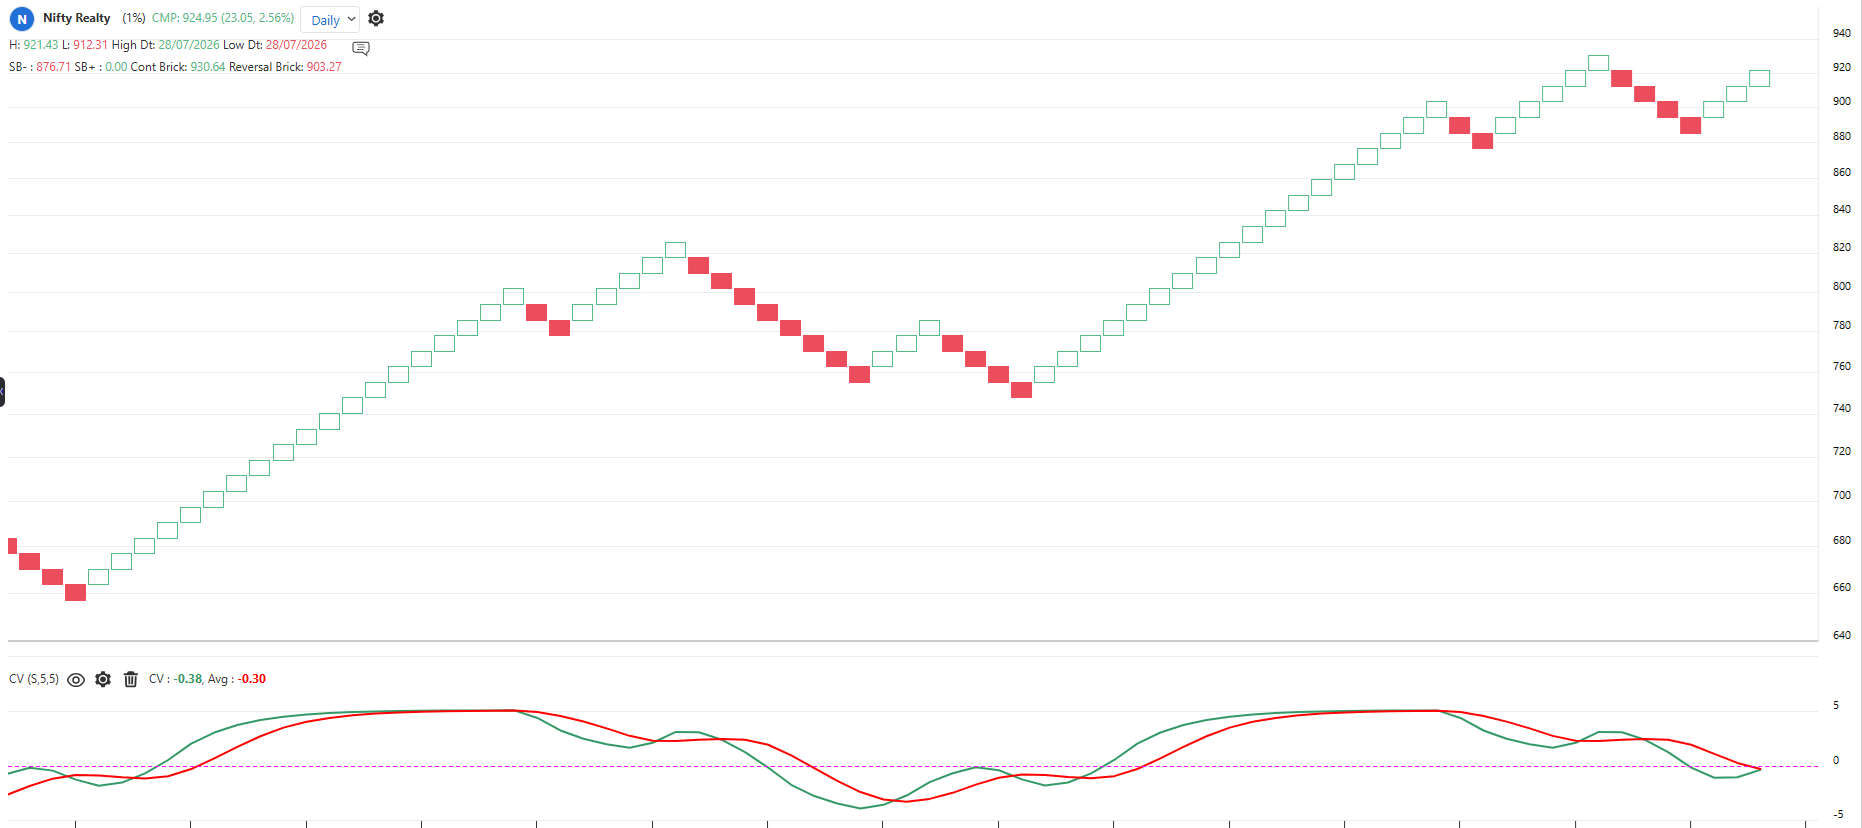
Default period: 5, 5 (range average, rate of change)
The indicator is applicable to all types of charting. Calculated based on the number of columns on P&F charts, bricks on Renko charts, lines on Line-break charts, candles on Heikin ashi charts, and lines on Kagi charts. While the formula and reading of the indicators remain the same, they become more dynamic on these charts.