Customer Support : 020-61923200, [email protected] | Call and Trade : 020-61923220

Donchian Bandwidth
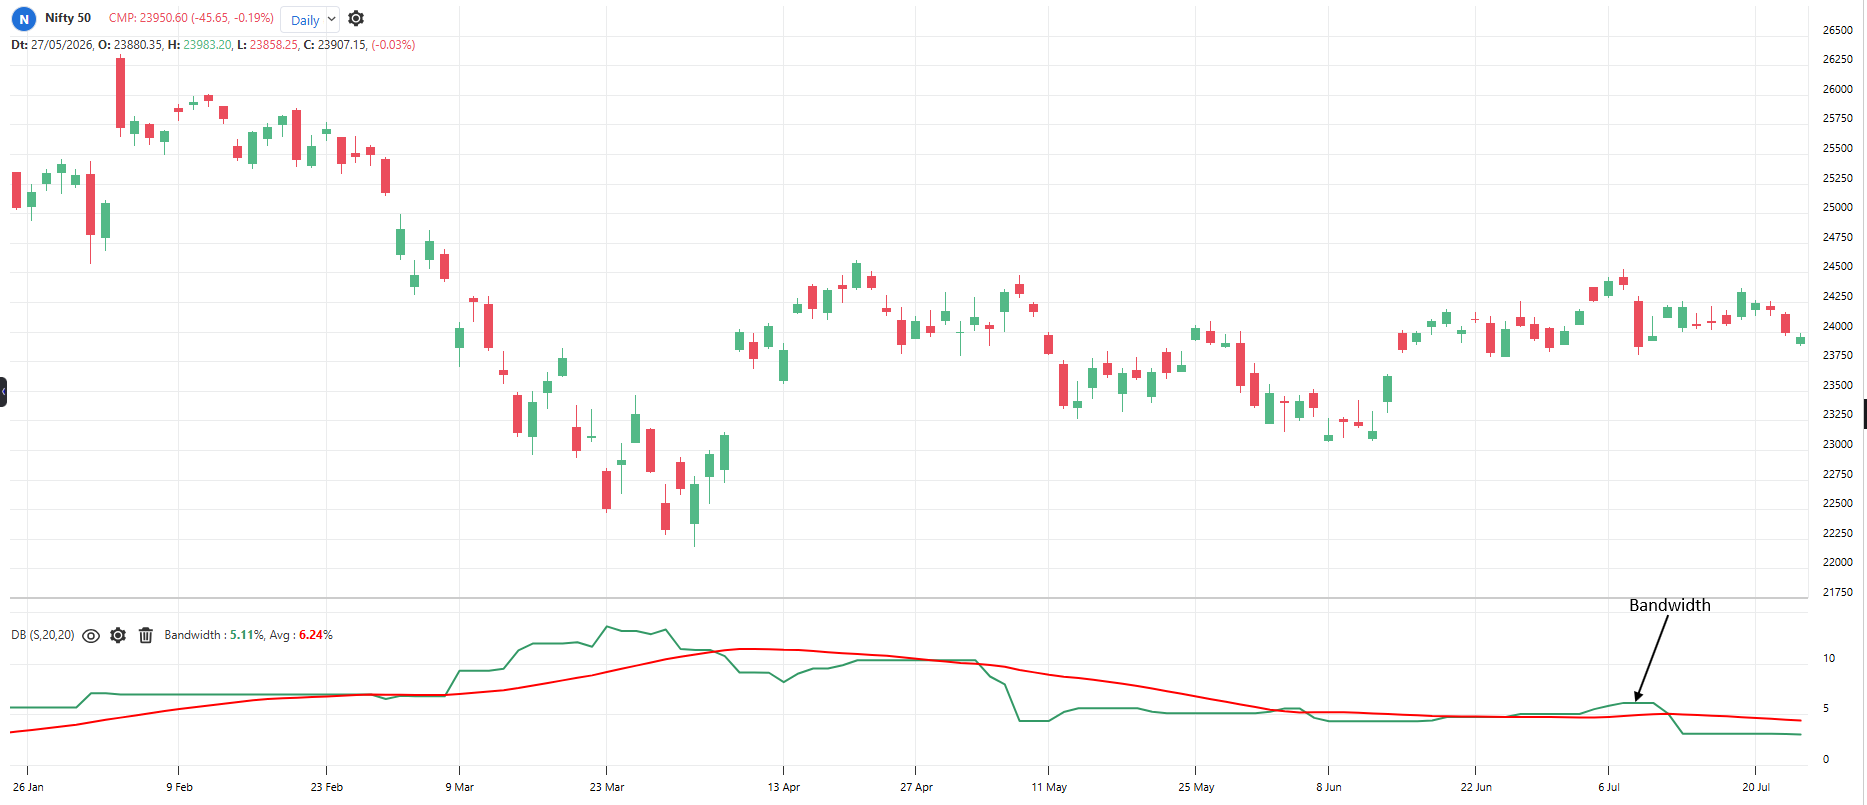
#volatility #squeeze
Inventor: Based on Richard Donchian’s channel
Measures the width of the Donchian Channel: highest high minus lowest low of the last N bars (often shown as a percentage of price). It tells you how big the recent trading range is. Narrow width means a tight quiet range, wide width means a big volatile range.
Default period: 20
Rising line indicates the range is expanding. Falling line indicates the range is tightening.
This indicator does not give direction. Pair it with a breakout signal.
Useful readings:
Bandwidth at multi-month low: Very tight range, breakout building
Bandwidth jumping up: Range broke, a new move is running
Bandwidth very high: Wide swings, cut position size
Bandwidth flat and low for weeks: Long consolidation, the breakout usually travels far
Bandwidth shrinking after a big move: Trend resting or ending
Objective rules:
Expansion: Bandwidth rises above its 20-period average.
Contraction: Bandwidth falls below its 20-period average.
Squeeze breakout long: Bandwidth at 100-bar low AND price closes above the upper Donchian line
Squeeze breakout short: Bandwidth at 100-bar low AND price closes below the lower Donchian line
Risk rule: When bandwidth doubles from its recent low, halve fresh position size
What makes it unique:
It reduces the Donchian Channel to its width, turning the size of the recent range into a single line. A multi-week low in this line is a coiled spring you can screen for.
Click here to know more about Donchian Channel.
The indicator table value in TradePoint & RZone also provides you with a list of all values of this indicator for any group of stocks. This will allow you to compare the readings of this indicator across different stocks.
This indicator is also available in the System Builder of RZone & TradePoint for all charting methods. Using the system builder, you can develop various strategies based on the different conditions already present in this indicator. Additionally, it can be used with other indicators or price patterns to develop effective trading strategies. For any group of stocks and market segments, you can scan and backtest stocks based on those strategies.
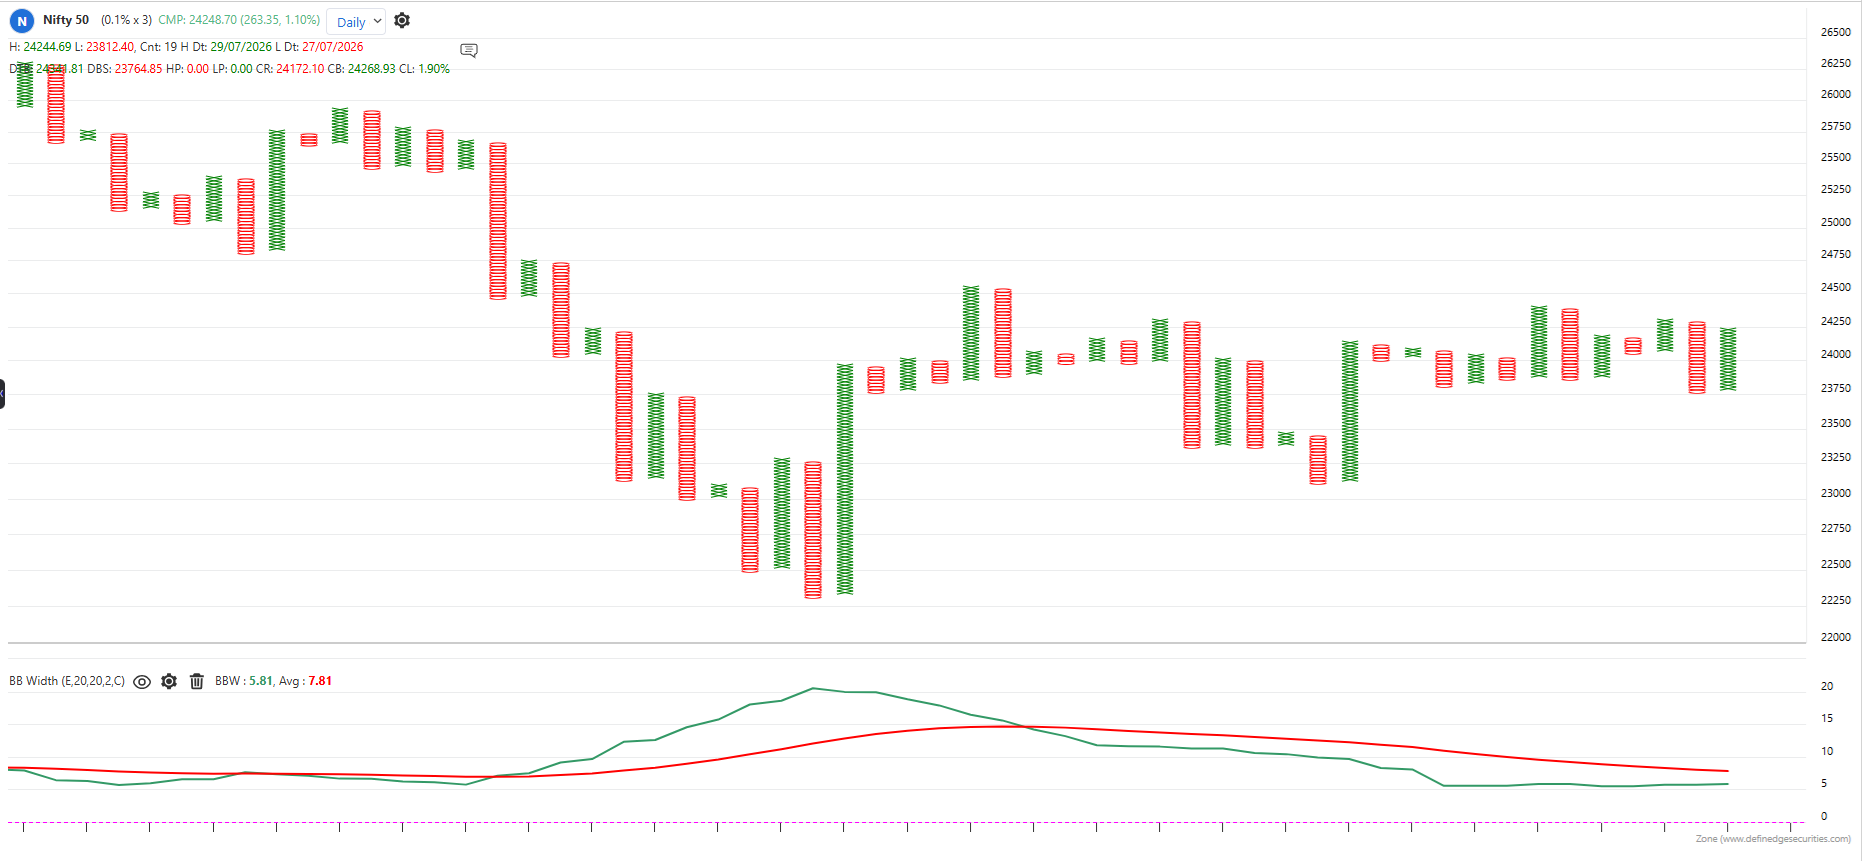
Default period: 20
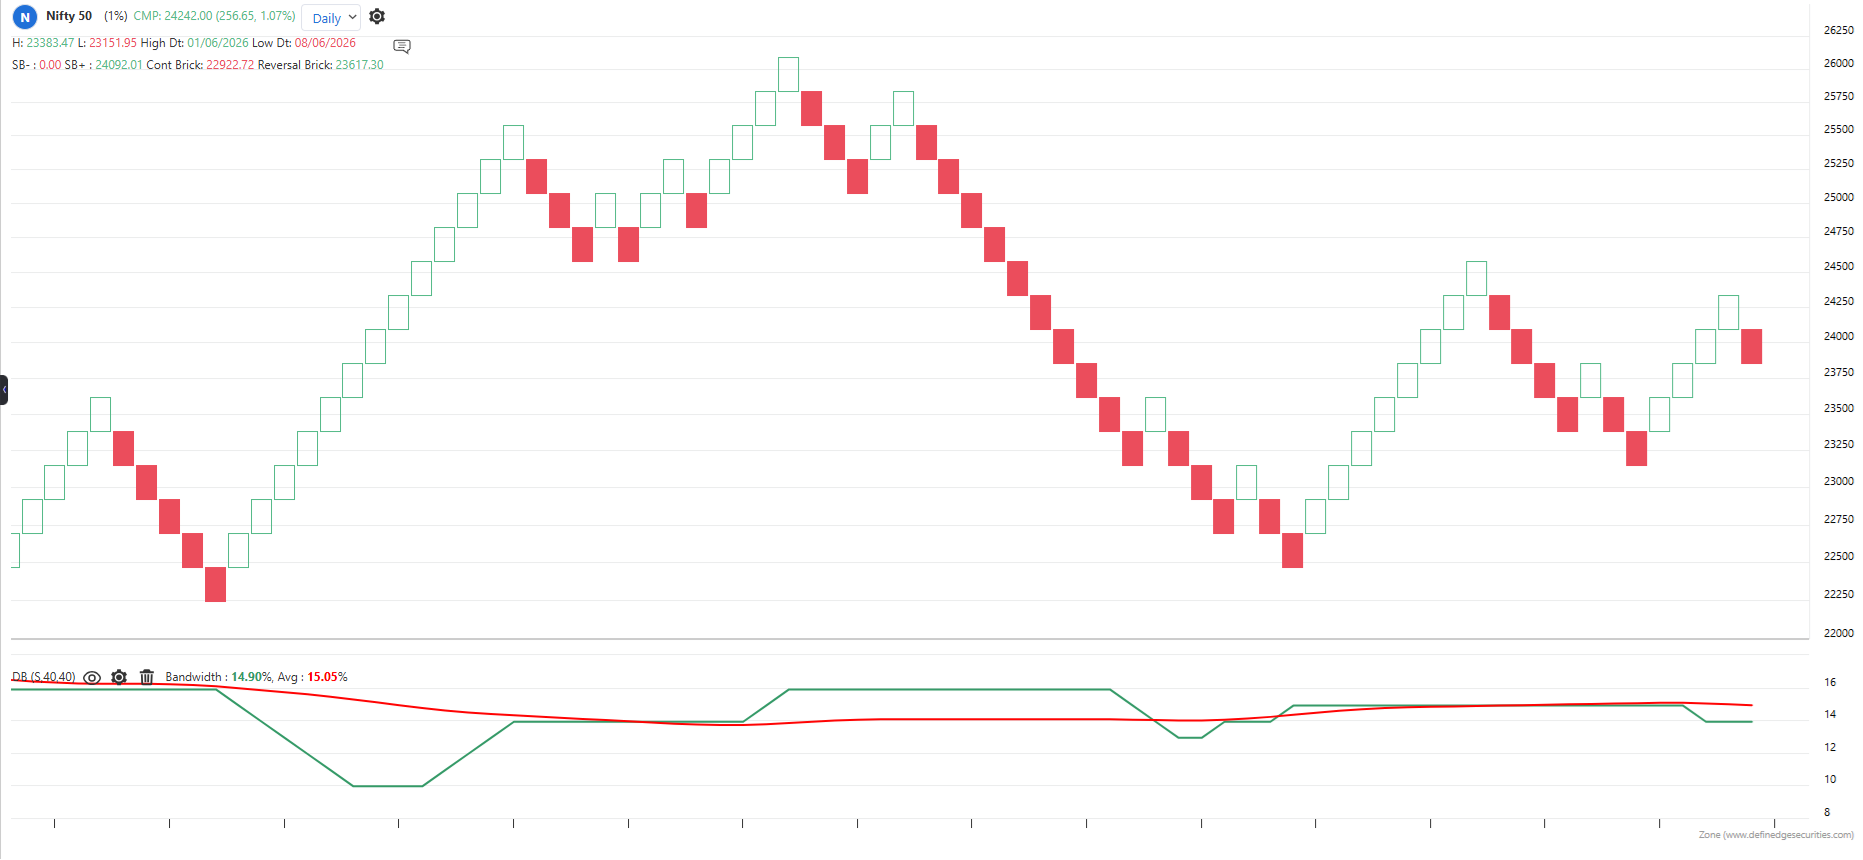
Default period: 40
The indicator is applicable to all types of charting. Calculated based on the number of columns on P&F charts, bricks on Renko charts, lines on Line-break charts, candles on Heikin ashi charts, and lines on Kagi charts. While the formula and reading of the indicators remain the same, they become more dynamic on these charts.