Customer Support : 020-61923200, [email protected] | Call and Trade : 020-61923220

Single Moving Average
#trendfollowing #movingaverage
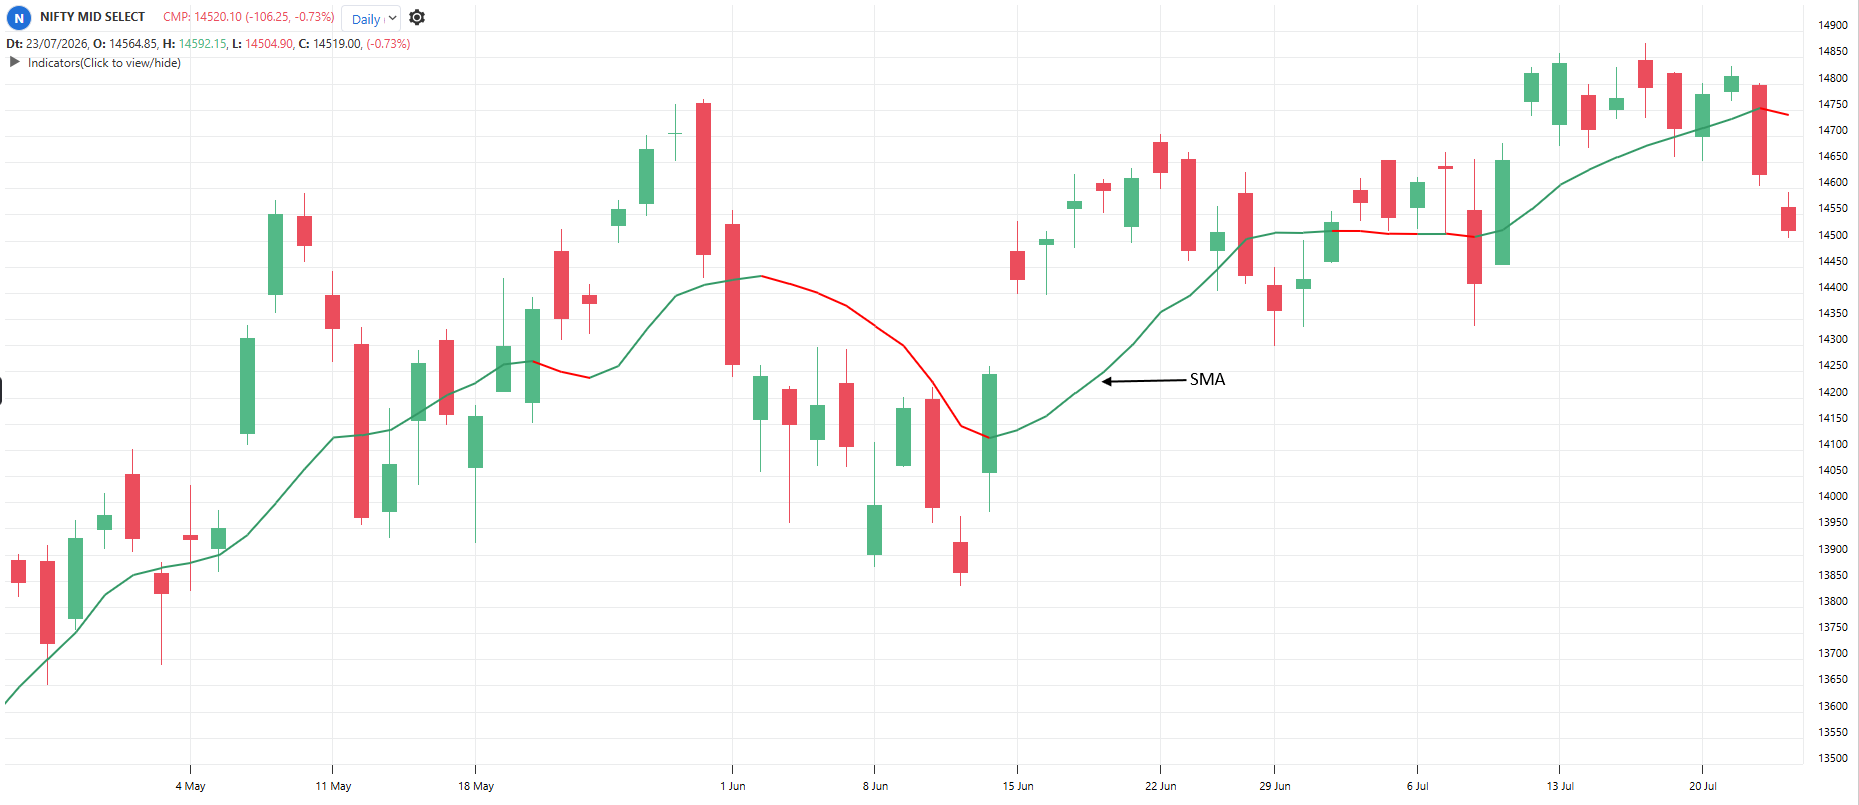
The simplest trend tool: one moving average of closing prices. Price above the average means the trend is up, price below means the trend is down. The average also acts as moving support in uptrends and moving resistance in downtrends.
Default period: 10
Rising average indicates uptrend. Falling average indicates downtrend. Flat average indicates sideways market.
Useful readings:
Price above rising average: Uptrend, buy dips toward the average
Price below falling average: Downtrend, sell rises toward the average
Price crossing a flat average repeatedly: Sideways market, ignore crossovers
Price far above the average: Stretched, wait for a dip
Average slope matters more than the cross itself
200-period average: The classic bull/bear dividing line
Objective rules:
Bullish: Price closes above the moving average AND the average is rising.
Bearish: Price closes below the moving average AND the average is falling.
Dip buy: In an uptrend, buy when price pulls back to within 1% of the rising average
Long exit: Two consecutive closes below the average
Flat filter: Skip signals when the average has moved less than 1% in 20 bars
What makes it unique:
It is the most-watched line in all of markets, which gives it self-fulfilling power. Everything else in trend following is a refinement of this one idea.
The indicator table value in TradePoint & RZone also provides you with a list of all values of this indicator for any group of stocks. This will allow you to compare the readings of this indicator across different stocks.
This indicator is also available in the System Builder on RZone & TradePoint for all charting methods. Using the system builder, you can develop various strategies based on the different conditions already present in this indicator. Additionally, it can be used with other indicators or price patterns to develop effective trading strategies. For any group of stocks and market segments, you can scan and backtest stocks based on those strategies.
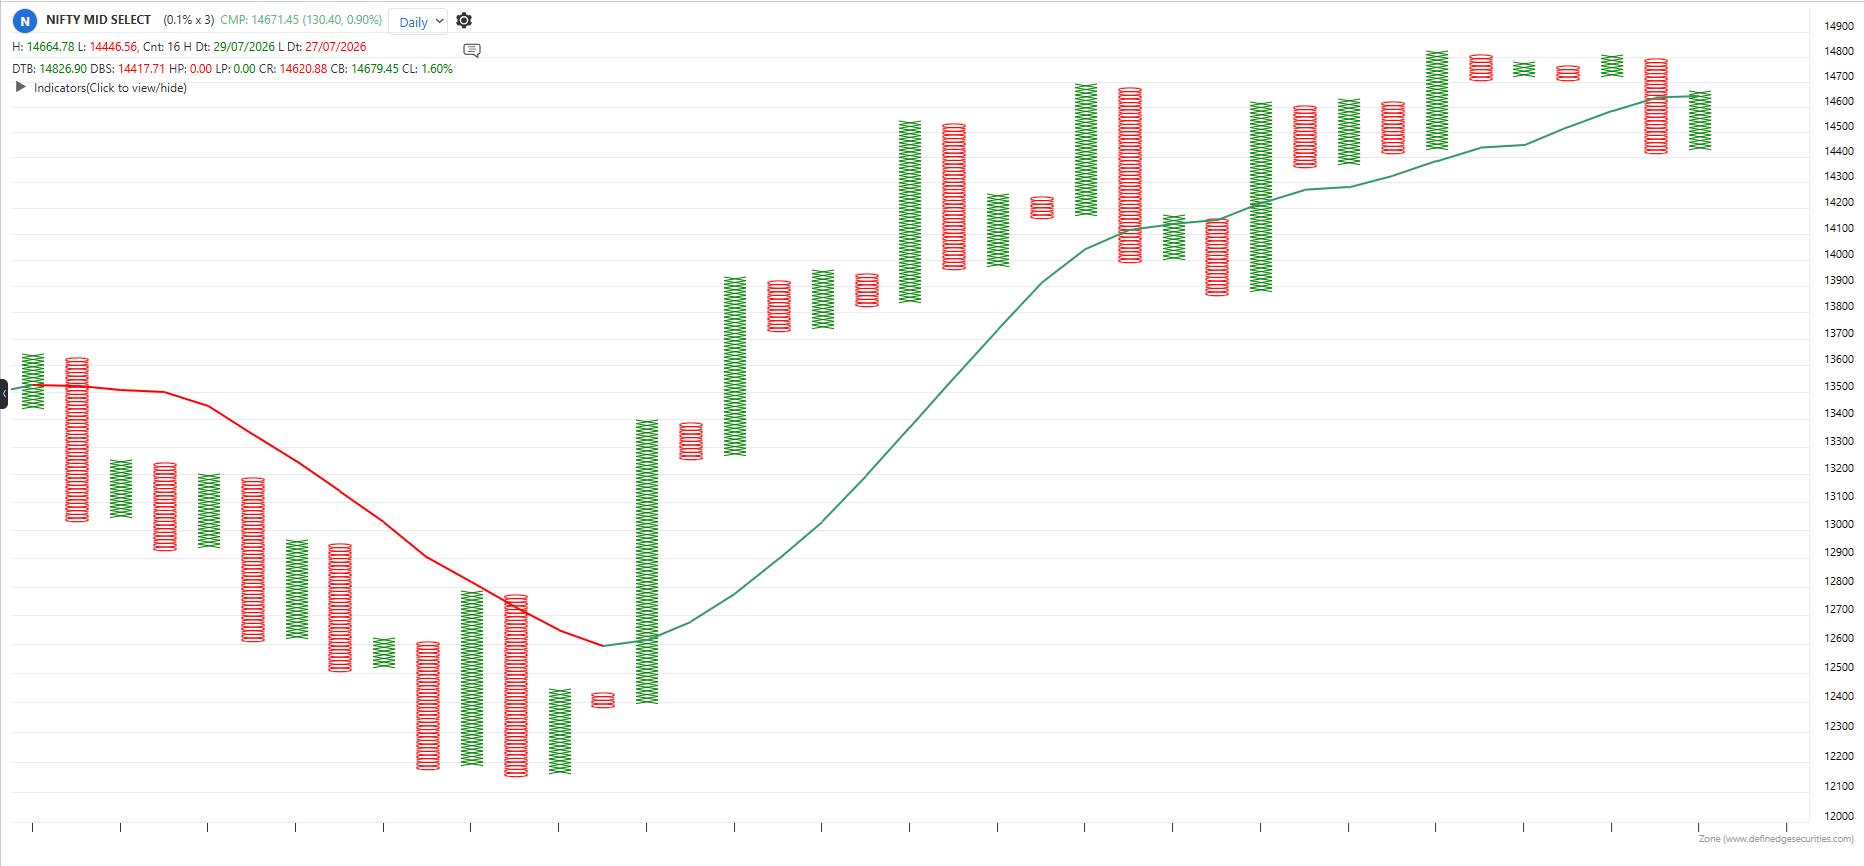
Default period: 10
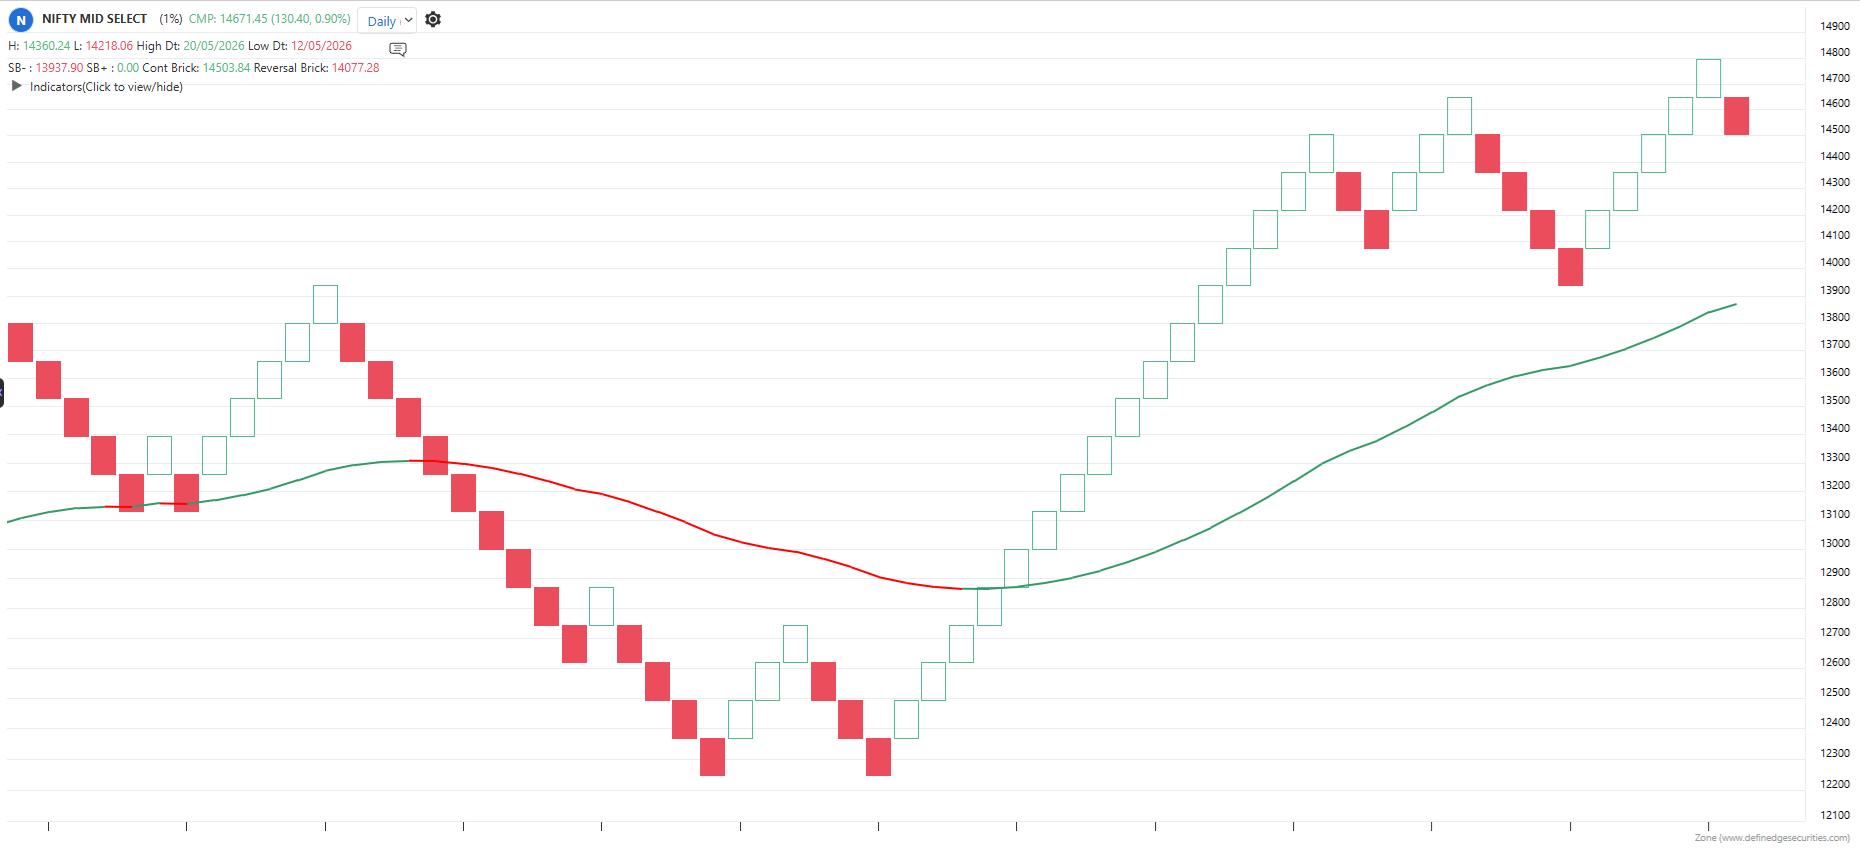
Default period: 40
The indicator is applicable to all types of charting. It is calculated based on the number of columns on P&F charts, bricks on Renko charts, lines on Line-break charts, candles on Heikin-Ashi charts, and lines on Kagi charts. While the formula and reading of the indicators remain the same, they become more dynamic on these charts.