Customer Support : 020-61923200, [email protected] | Call and Trade : 020-61923220

Coppock Indicator
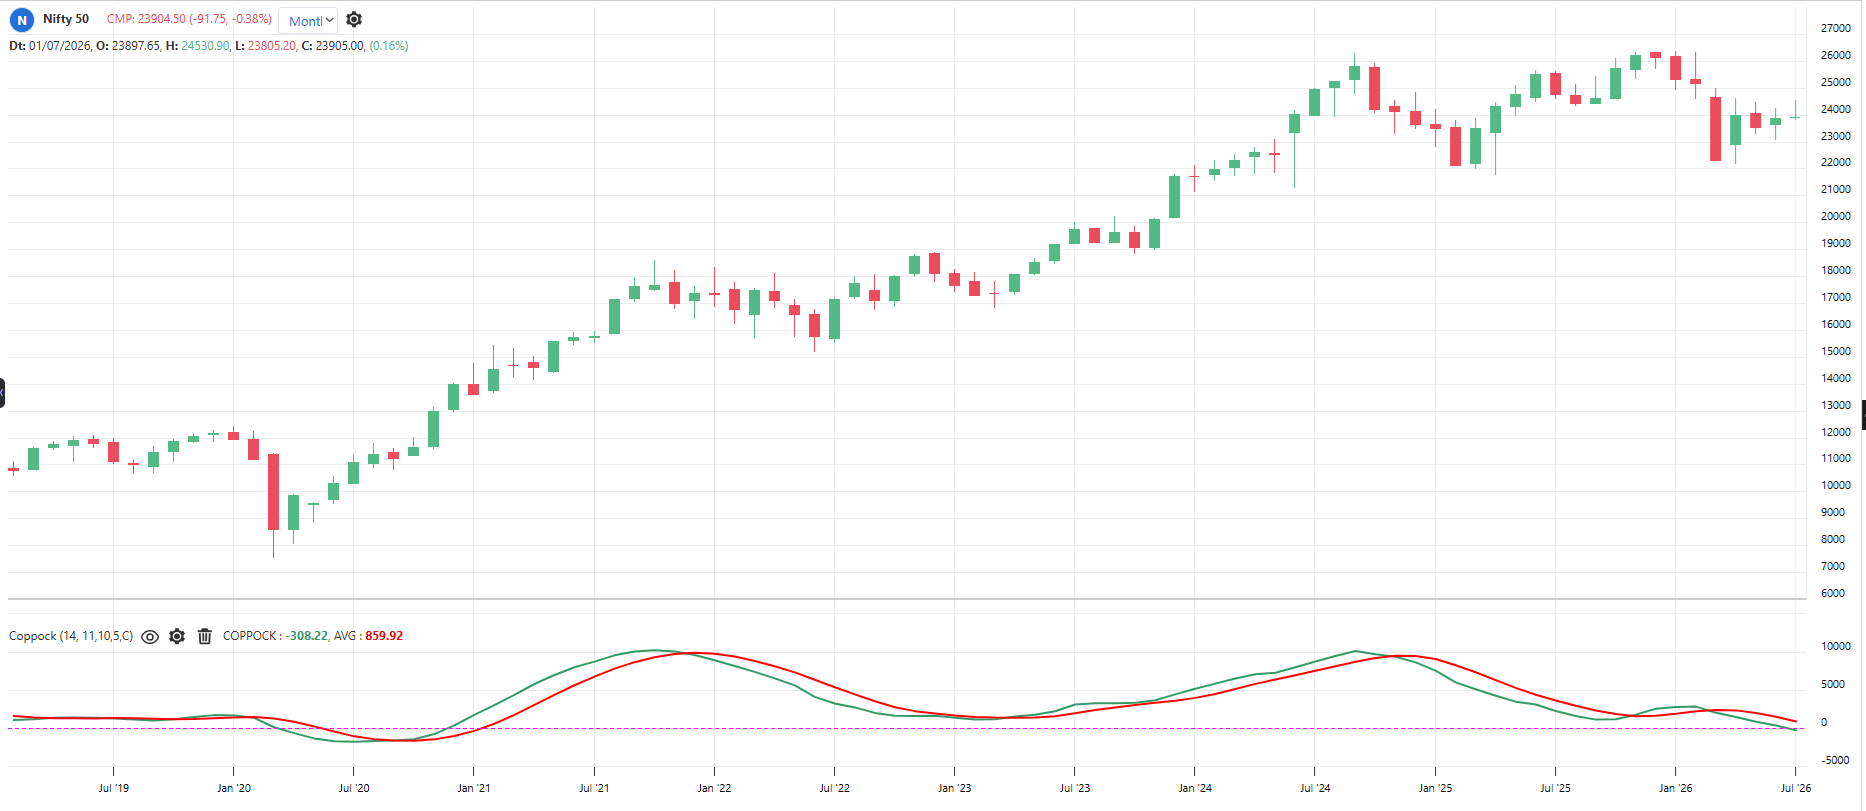
#momentum #longterm
Inventor: Edwin S. Coppock
A slow, long-term momentum tool built for monthly charts. It adds two rates of change (14 and 11 months) and smooths them with a 10-month weighted average. It was designed for one job: spotting major bear-market bottoms in stock indices.
Default period: 14, 11, 10 (ROC, ROC, weighted average) on monthly chart
Line below zero indicates bear phase. Line turning up from below zero indicates a major bottom forming.
Useful readings:
Turns up from below zero: Classic long-term buy signal for indices
Deeply below zero: Bear market mature, watch for the upturn
Above zero and rising: Bull market healthy
Above zero and falling: Bull market tiring, caution
Designed for buying bottoms; its sell signals are much less reliable
Meant for indices on monthly charts; less proven on single stocks or small timeframes
Objective rules:
Bullish: Coppock line turns up (current value higher than previous) while below zero.
Bearish: Coppock line turns down while above zero (use only as a caution flag, not a short signal).
Investment rule: Start buying in stages when the monthly Coppock upturn appears below zero
Hold rule: Stay invested while Coppock keeps rising
What makes it unique:
Its periods came from church bishops: asked how long people grieve, they said 11 to 14 months, and Coppock applied that to market mourning. It exists for exactly one signal – the major bear-market bottom.
The indicator table value in TradePoint & RZone also provides you with a list of all values of this indicator for any group of stocks. This will allow you to compare the readings of this indicator across different stocks.
This indicator is also available in the System Builder of RZone & TradePoint for all charting methods. Using the system builder, you can develop various strategies based on the different conditions already present in this indicator. Additionally, it can be used with other indicators or price patterns to develop effective trading strategies. For any group of stocks and market segments, you can scan and backtest stocks based on those strategies.
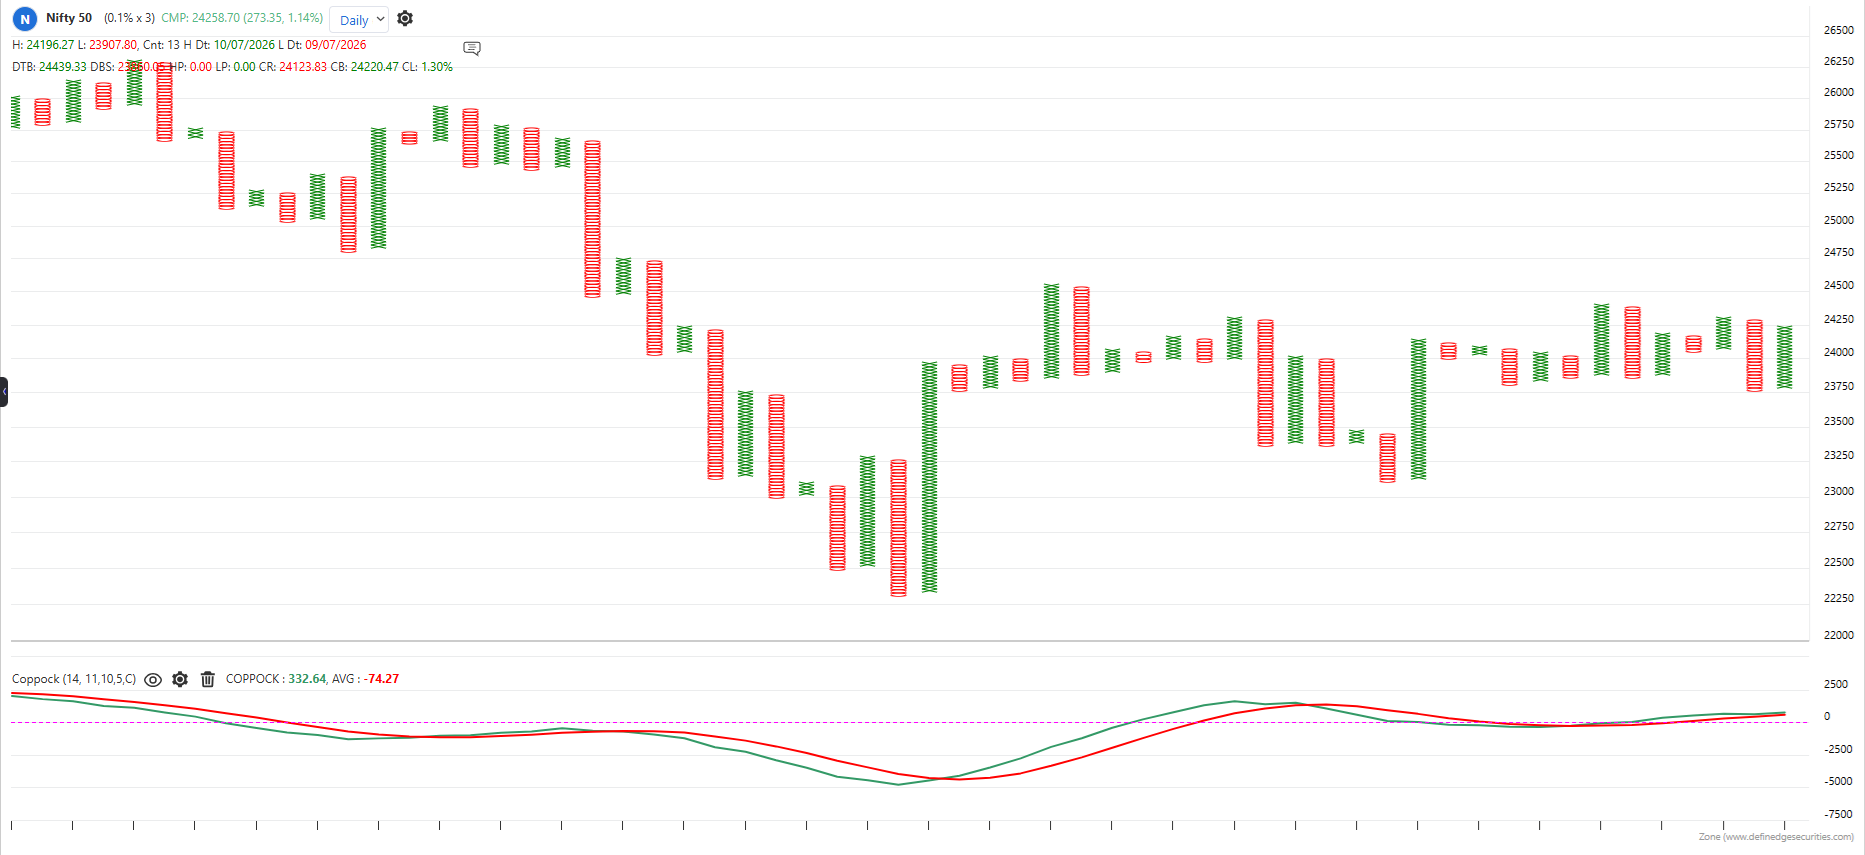
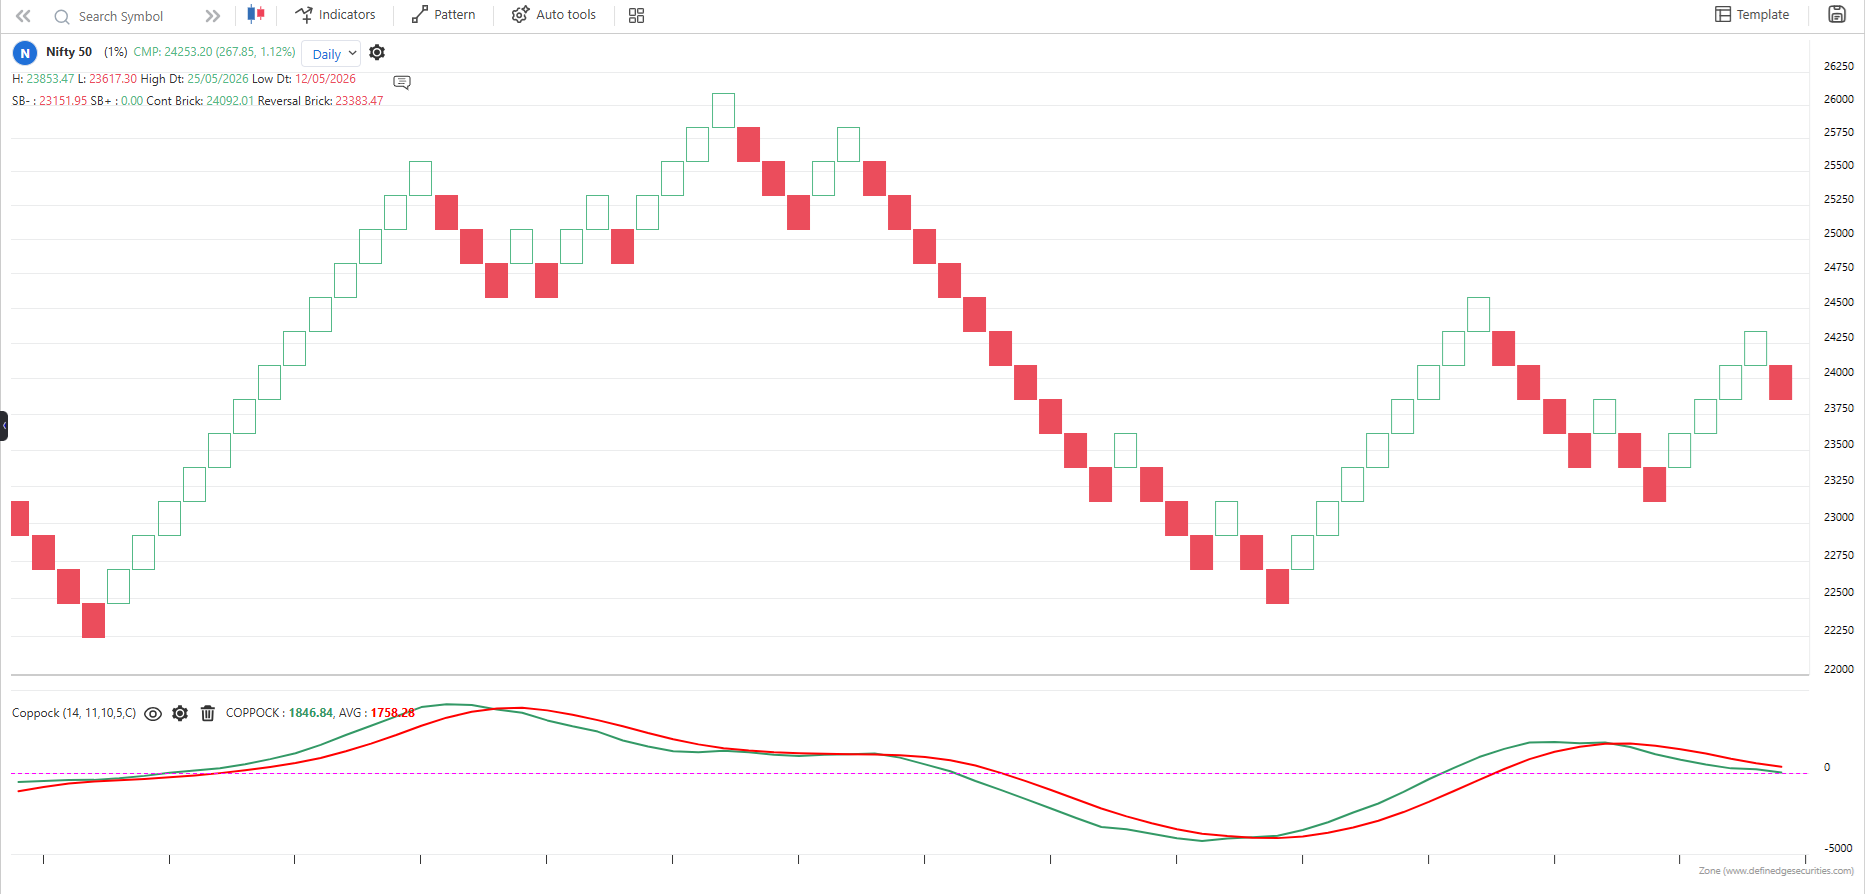
The indicator is applicable to all types of charting. Calculated based on the number of columns on P&F charts, bricks on Renko charts, lines on Line-break charts, candles on Heikin ashi charts, and lines on Kagi charts. While the formula and reading of the indicators remain the same, they become more dynamic on these charts.