Customer Support : 020-61923200, [email protected] | Call and Trade : 020-61923220

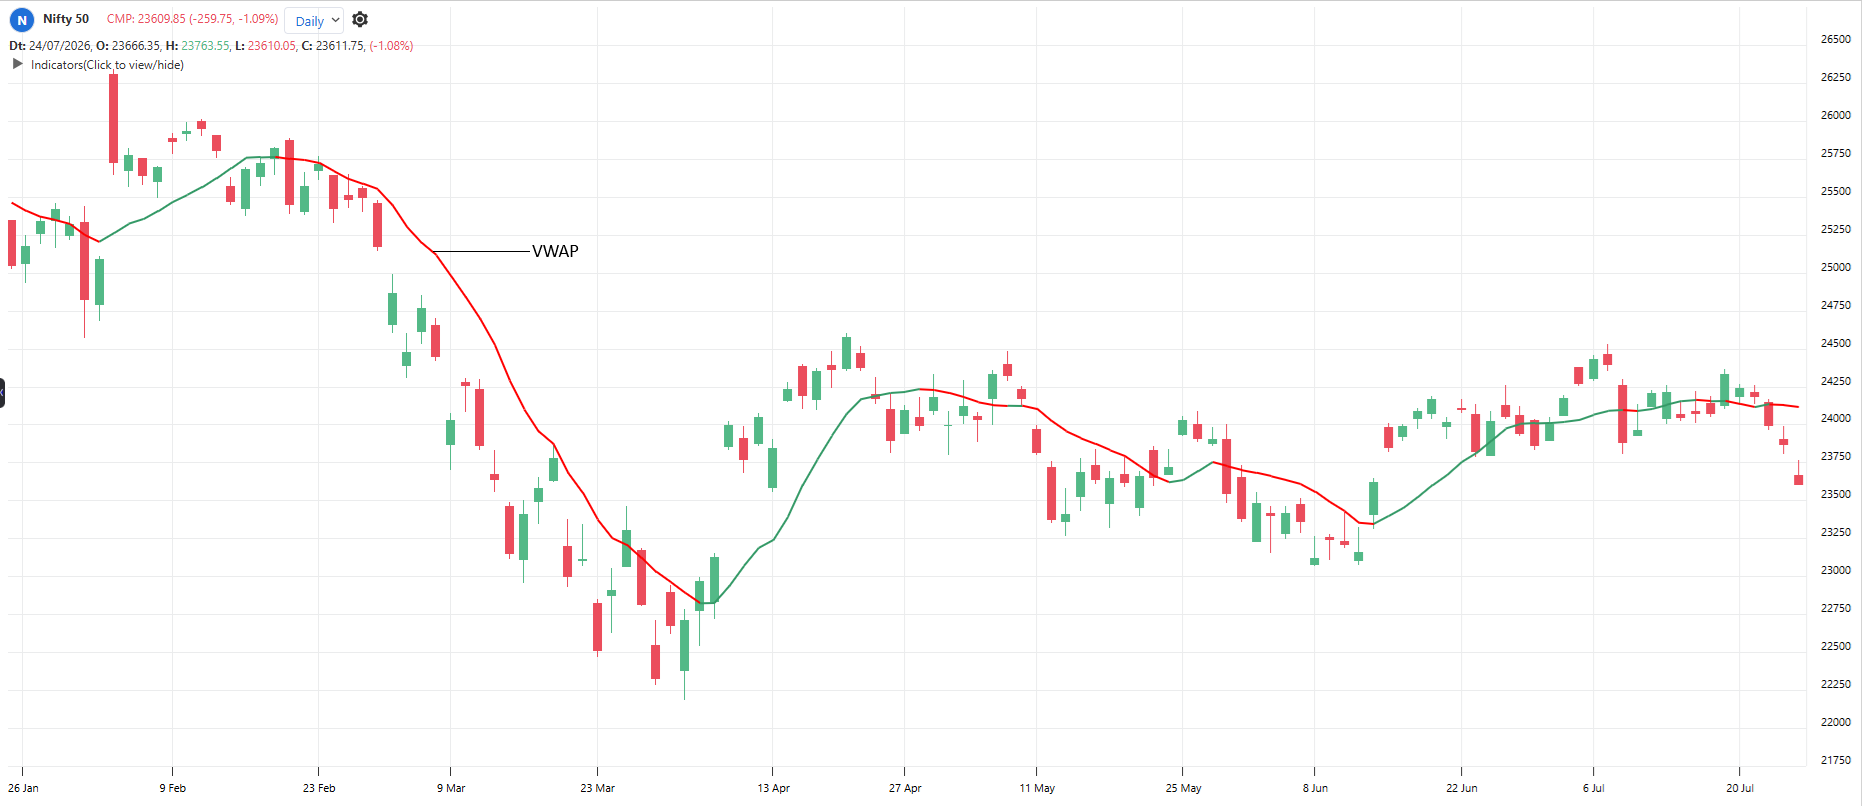
Single VWAP
#intraday #volume #benchmark
Period: 10
VWAP is a popular indicator that is followed by many traders. VWAP is an acronym for volume weighted average price. The indicator consists of volume and price and plots as a single line on the price chart.
The intraday VWAP indicator is calculated based on intraday data starting with the first candle of the day. Price and volume data are taken into account for each tick of each session. During the market session, the indicator starts anew every morning.
We can plot the VWAP indicator on any timeframe for a specific period instead of intraday VWAP. VWAP is calculated based on price and volume over the period defined by the user.
Based on the parameters defined by the user, a VWAP line can be plotted on any chart and timeframe. If, for example, the parameter is 10, the chart will display the volume weighted average price for the past 10 periods.
Useful readings:
Price holding above VWAP: Intraday uptrend, dips to VWAP are buyable
Price holding below VWAP: Intraday downtrend, rises to VWAP get sold
Price crossing VWAP repeatedly: Balanced day, range trading
Price far from VWAP: Stretched intraday move, snap-back risk
VWAP flat all day: No conviction either side
First touch of VWAP after a strong open often gives the best intraday entry
Objective rules:
Bullish: Price closes above VWAP on a 5 or 15 minute chart.
Bearish: Price closes below VWAP on a 5 or 15 minute chart.
Dip buy: In an intraday uptrend, buy the first pullback that holds at VWAP
Long exit: Price closes below VWAP after being above it
Trend day filter: If price has not crossed VWAP since the first hour, trade only in that day’s direction
What makes it unique:
It is the only indicator that is also an institutional benchmark – big desks are graded against it. Price respects it because the largest players are forced to care about it.
The indicator table value in TradePoint & RZone also provides you with a list of all values of this indicator for any group of stocks. This will allow you to compare the readings of this indicator across different stocks.
This indicator is also available in the System Builder of RZone & TradePoint for all charting methods. Using the system builder, you can develop various strategies based on the different conditions already present in this indicator. Additionally, it can be used with other indicators or price patterns to develop effective trading strategies. For any group of stocks and market segments, you can scan and backtest stocks based on those strategies.
The indicator is applicable to all types of charting. Calculated based on the number of columns on P&F charts, bricks on Renko charts, lines on Line-break charts, candles on Heikin ashi charts, and lines on Kagi charts. While the formula and reading of the indicators remain the same, they become more dynamic on these charts.