Customer Support : 020-61923200, [email protected] | Call and Trade : 020-61923220

ATR Stop-loss Indicator
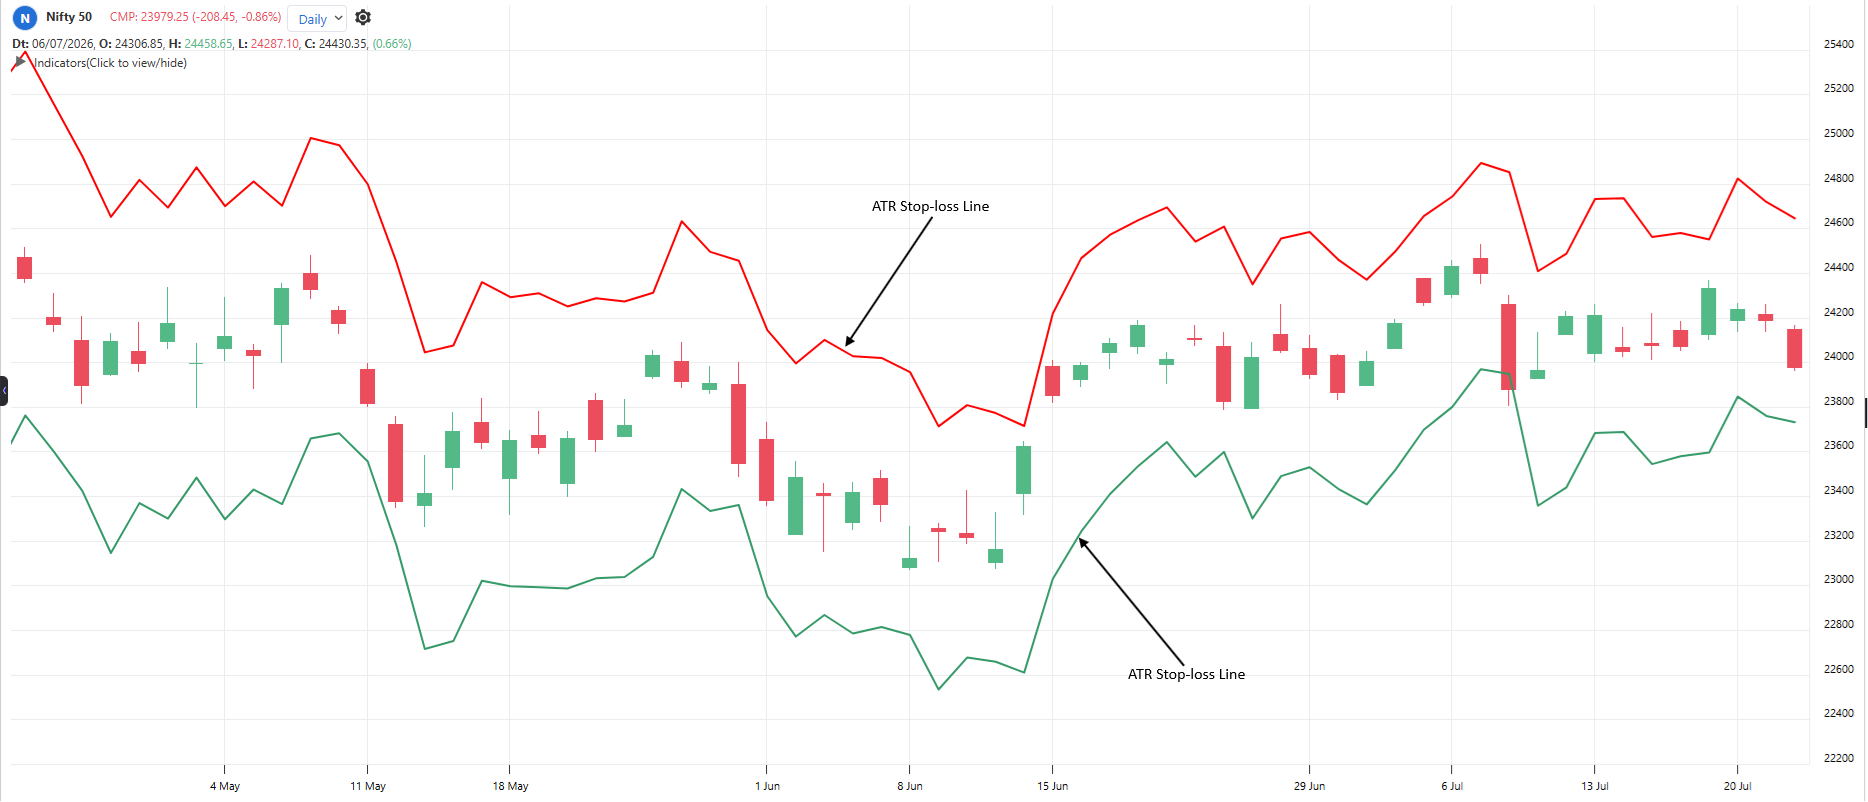
#volatility #trendfollowing #stoploss
Inventor: Based on J. Welles Wilder Jr.’s ATR
Plots two stop-loss lines using ATR. The bullish line sits below price (Close – ATR x Multiplier) and the bearish line sits above price (Close + ATR x Multiplier). Each line moves only one way – the bullish line only rises; the bearish line only falls – until price closes across it and the trend flips. It is the same calculation as Super Trend, shown as two separate lines instead of one combined line.
Default period: 10, 2 (ATR period, multiplier)
Price above the bullish line indicates uptrend, trail your stop on the bullish line. Price below the bearish line indicates downtrend, trail your stop on the bearish line.
Useful readings:
Bullish line rising every bar: Strong and steady uptrend
Bullish line flat for many bars: Uptrend paused, price moving sideways above the stop
Bearish line falling every bar: Strong and steady downtrend
Line far from price: High volatility, wide risk per trade, reduce position size
Line very close to price: Quiet market, tight stop, whipsaw risk
Higher multiplier (3x): Wider stop, fewer whipsaws, suits positional trades
Lower multiplier (1.5-2x): Tighter stop, faster exits, suits swing trades
Objective rules:
Bullish: Price closes above the bearish line.
Bearish: Price closes below the bullish line.
Long trailing stop: Exit long when price closes below the bullish line
Short trailing stop: Exit short when price closes above the bearish line
Position size rule: Risk per share = Entry price – bullish line value; divide your fixed money risk by this to get quantity
Whipsaw filter: Skip signal if previous flip occurred within last 5 bars
What makes it unique:
It sizes the stop by the market’s own noise, so quiet stocks get tight stops, and wild stocks get room automatically. The one-way ratchet turns raw ATR into a disciplined trailing exit.
The indicator table value in TradePoint & RZone also provides you with a list of all values of this indicator for any group of stocks. This will allow you to compare the readings of this indicator across different stocks.
This indicator is available in the System Builder on RZone & TradePoint for all charting methods. Using the system builder, you can develop various strategies based on the different conditions already present in this indicator. Additionally, it can be used with other indicators or price patterns to develop effective trading strategies. For any group of stocks and market segments, you can scan and backtest stocks based on those strategies.
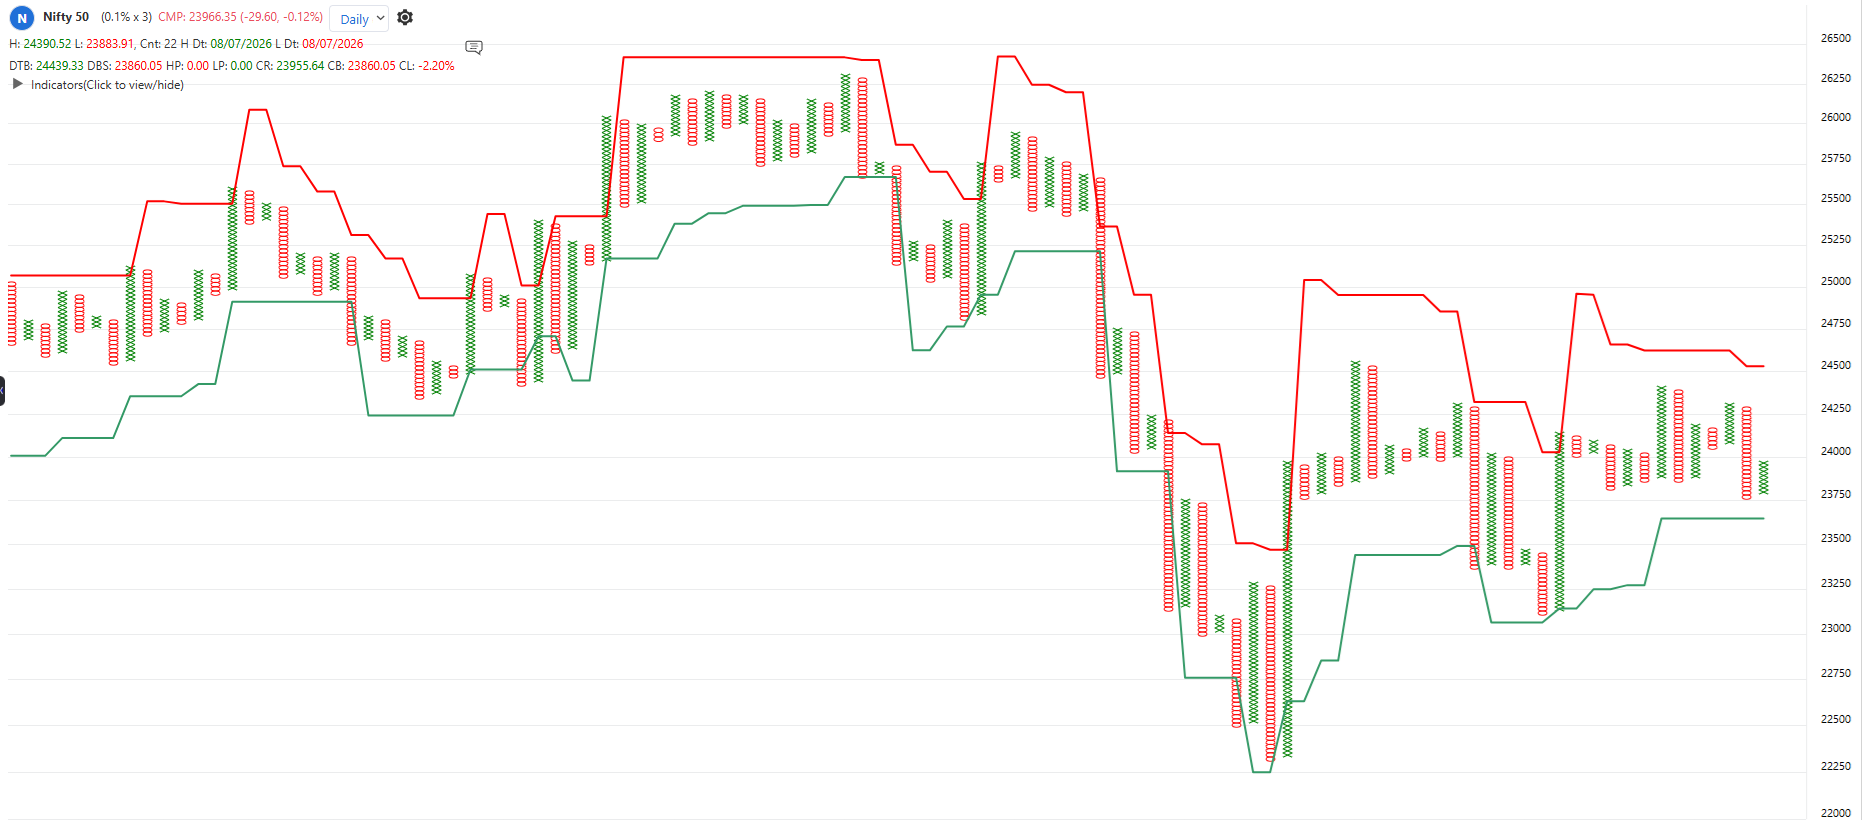
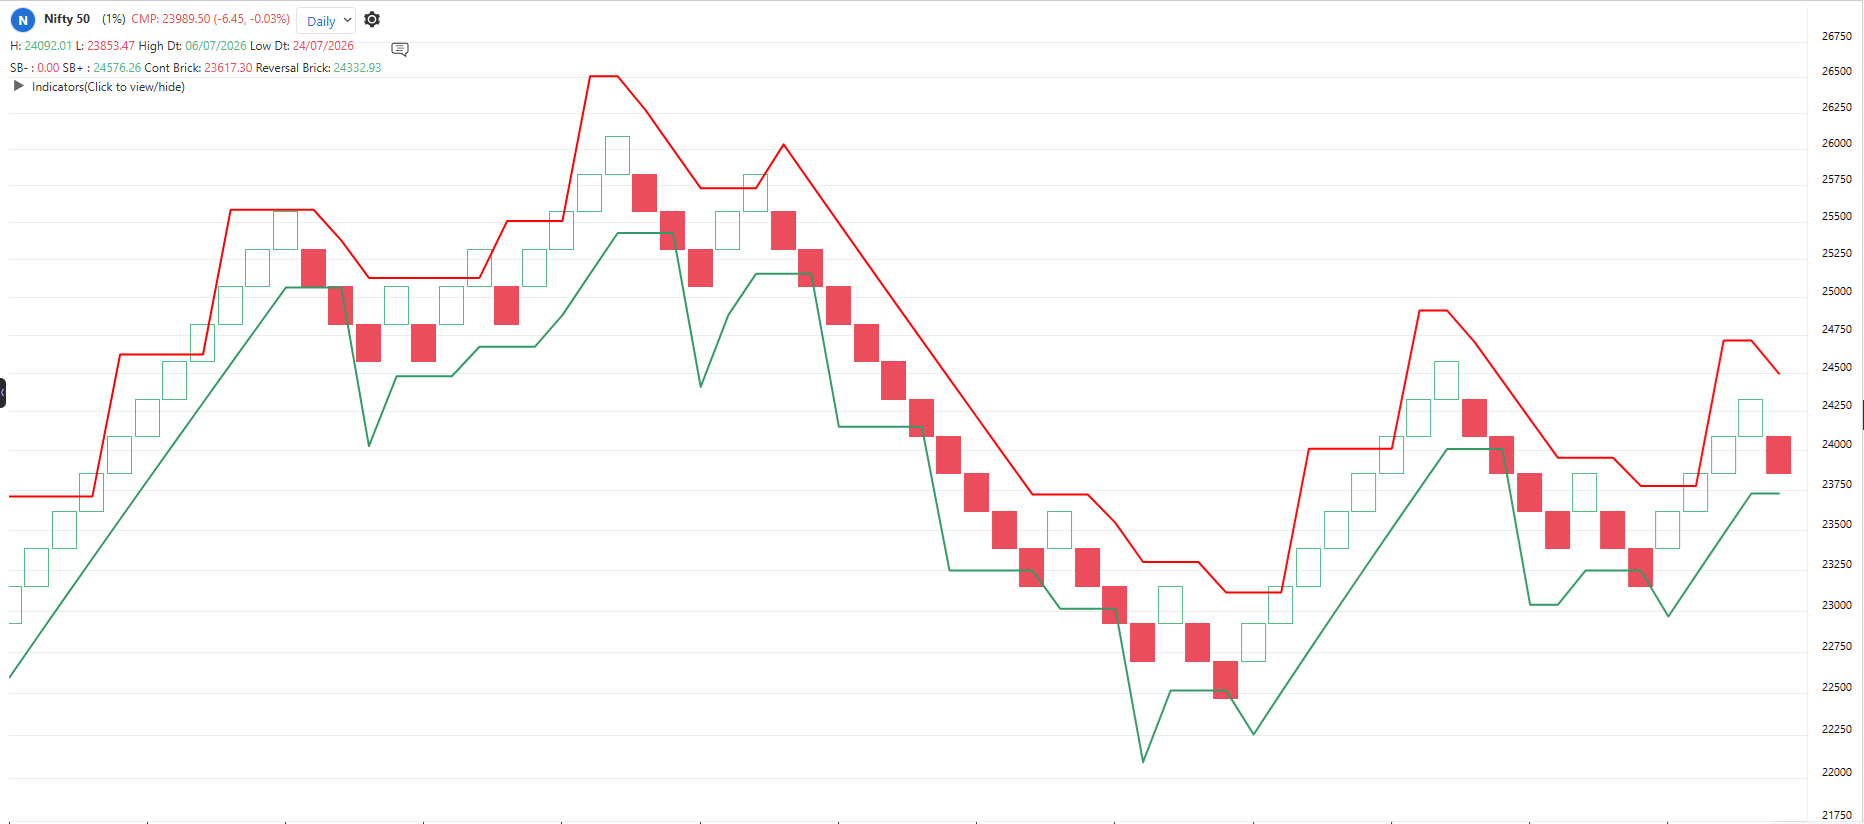
The indicator is applicable to all types of charting. It is calculated based on the number of columns on P&F charts, bricks on Renko charts, lines on Line-break charts, candles on Heikin-Ashi charts, and lines on Kagi charts. While the formula and reading of the indicators remain the same, they become more dynamic on these charts.