Customer Support : 020-61923200, [email protected] | Call and Trade : 020-61923220

BBA Volatility Squeeze
#volatility #breakout #squeeze
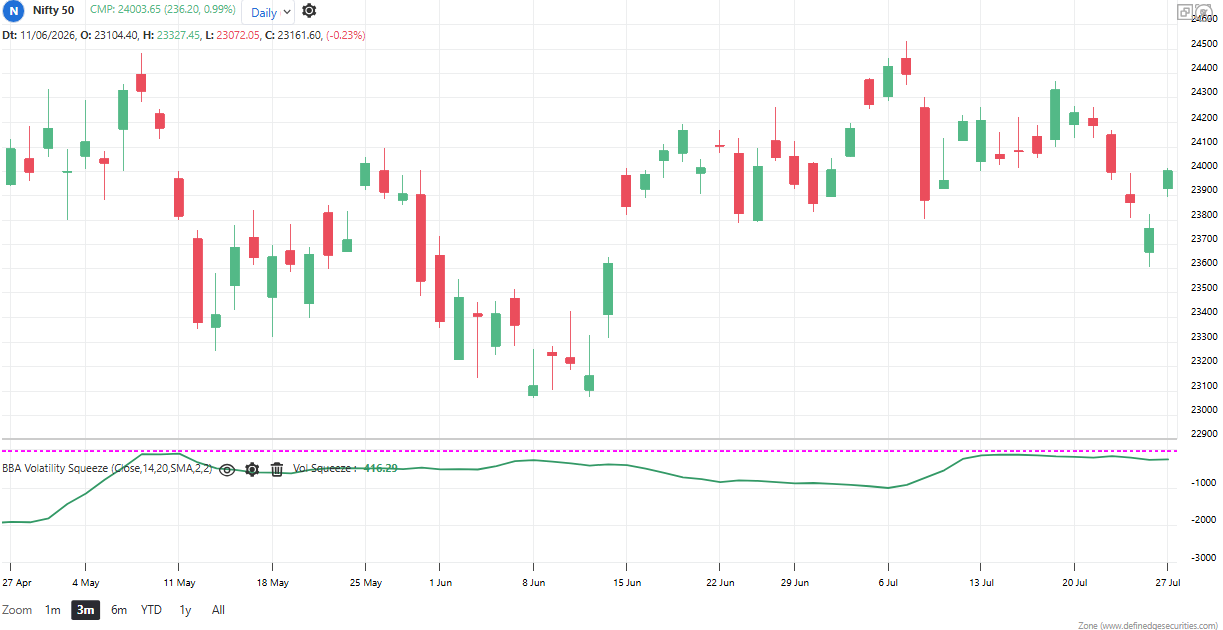
Measures how quiet the market has become. When the number goes above zero, the bands have shrunk unusually tight — price is coiling like a spring. When it drops back below zero, the spring has released and a big move has started.
Default period: 14, 2.0, 2.
Indicator above zero indicates squeeze ON (quiet market, move building). Indicator below zero indicates squeeze OFF (normal or expanding volatility).
Useful readings:
• Crosses above zero: Market going quiet, breakout building, prepare but do not trade yet
• Above zero for 6–10+ bars: Long compression, bigger move expected when it releases
• Crosses back below zero: Squeeze fired, the move has begun — this is the trigger bar
• Falling deeper below zero: Volatility expanding, move already running, late to enter, manage the trade instead
• Above zero for only 1–2 bars: Weak squeeze, breakout less trustworthy
• Many squeezes with no follow-through: Sideways, dead market — trade smaller or skip
Objective rules:
• Squeeze ON: ATR × Multiplier > Band Size (indicator > 0)
• Squeeze OFF / fired: First bar where indicator drops back below 0
• Long entry: Squeeze fires AND close is above the 20 SMA (or close breaks the upper band)
• Short entry: Squeeze fires AND close is below the 20 SMA (or close breaks the lower band)
• Duration filter: Only trade fires where the squeeze lasted at least 5 bars
• Exit: Trail with SuperTrend or exit when momentum (Close − SMA) starts shrinking
What makes it unique:
Most indicators tell you which way price is going. This one tells you when a move is likely — it finds the calm before the storm. By comparing two different volatility measures (band width from closing prices vs ATR from full bar ranges), it turns “the market looks quiet” into a simple, testable number: above zero means loaded, below zero means released.
The main trap to avoid: entering during the squeeze because you are impatient. Above zero means wait; the money is made on the release, not the coil.
The indicator table value in TradePoint & RZone also provides you with a list of all values of this indicator for any group of stocks. This will allow you to compare the readings of this indicator across different stocks.
This indicator is available in the System Builder on RZone & TradePoint for all charting methods. Using the system builder, you can develop various strategies based on the different conditions already present in this indicator. Additionally, it can be used with other indicators or price patterns to develop effective trading strategies. For any group of stocks and market segments, you can scan and backtest stocks based on those strategies.
Click here to learn more about the indicator.
The indicator is applicable to all types of charting. It is calculated based on the number of columns on P&F charts, bricks on Renko charts, lines on Line-break charts, candles on Heikin-Ashi charts, and lines on Kagi charts. While the formula and interpretation of the indicators remain the same, they become more dynamic on these charts.