Customer Support : 020-61923200, [email protected] | Call and Trade : 020-61923220

Price Momentum Oscillator (PMO)
#momentum #oscillator #crossover #divergence #trend-strength
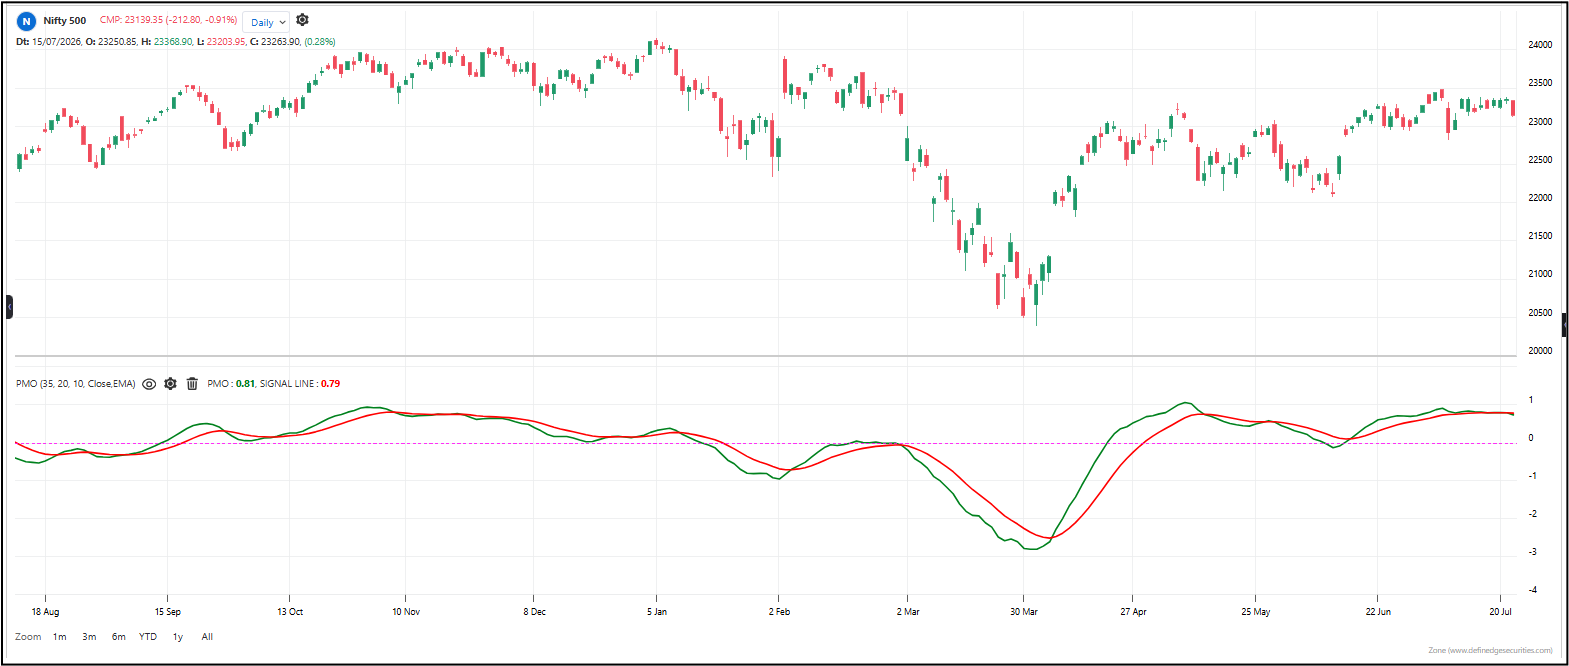
The PMO measures the acceleration and deceleration of price momentum. Instead of just tracking whether price is going up or down, it tracks how fast the rate of price change is itself changing. It does this by applying a double-smoothing process to daily price changes, then comparing the result to a signal line. The PMO is excellent at spotting momentum shifts before price actually reverses.
Default period: 35 (momentum smoothing), 20 (signal line)
Line behavior:
Oscillates above and below a zero line. Above zero means momentum is broadly positive; below zero means momentum is broadly negative. A second, slower signal line moves through the PMO line. Crossovers between the PMO and its signal line generate trading signals. The PMO line is smooth enough to avoid constant whipsaws but responsive enough to catch real momentum changes.
Useful readings:
Above zero: Bullish momentum dominates
Below zero: Bearish momentum dominates
PMO crossing above signal line: Momentum is accelerating to the upside
PMO crossing below signal line: Momentum is accelerating to the downside
PMO rising while price makes lower lows: Bullish divergence — downtrend may be exhausting
PMO falling while price makes higher highs: Bearish divergence — uptrend may be exhausting
Extreme high/low PMO readings: Momentum is stretched; reversal or pullback likely
Objective rules:
Buy when PMO crosses above its signal line, especially when both are above zero
Sell when PMO crosses below its signal line, especially when both are below zero
Avoid buying when PMO is extremely high (overextended momentum)
Avoid selling when PMO is extremely low (overextended momentum)
Divergence between PMO and price is one of the strongest reversal warnings
PMO rising confirms a healthy uptrend; PMO falling confirms a healthy downtrend
What makes it unique:
The double-smoothing process makes the PMO far less noisy than a raw ROC or RSI. It captures the second derivative of price (how momentum itself is changing), which means it often turns before price does. This makes it one of the most reliable divergence indicators available.
The indicator table value in TradePoint & RZone also provides you with a list of all values of this indicator for any group of stocks. This will allow you to compare the readings of this indicator across different stocks.
This indicator is also available in the System Builder on RZone & TradePoint for all charting methods. Using the system builder, you can develop various strategies based on the different conditions already present in this indicator. Additionally, it can be used with other indicators or price patterns to develop effective trading strategies. For any group of stocks and market segments, you can scan and backtest stocks based on those strategies.
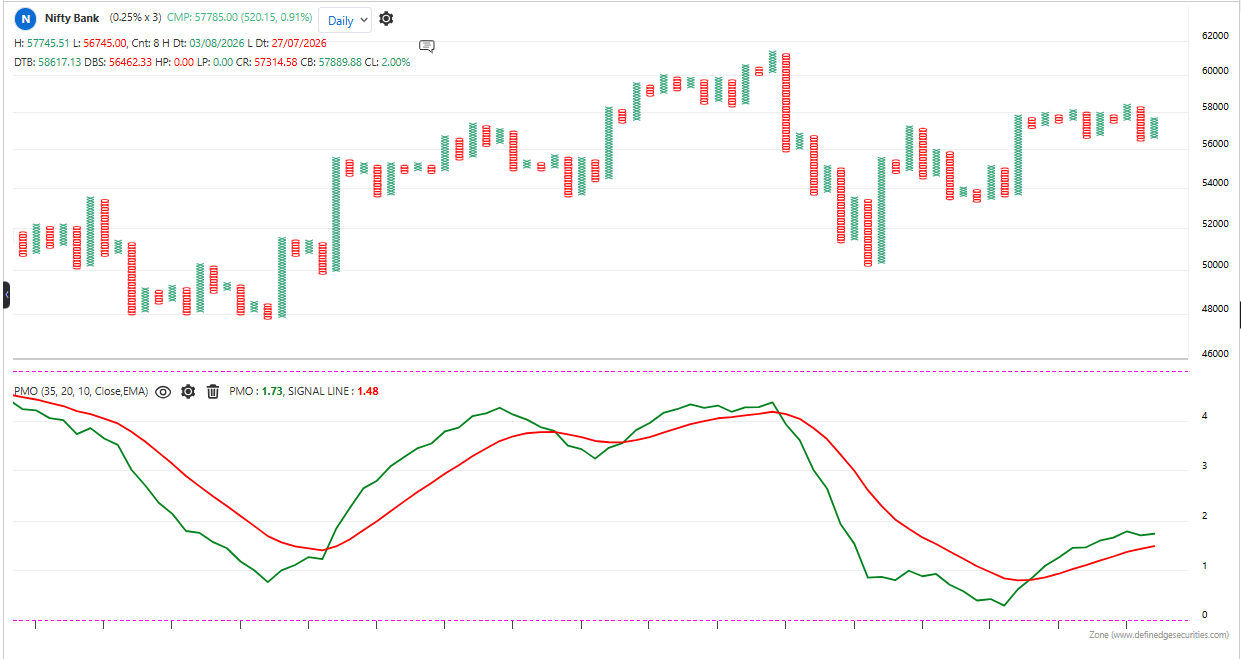
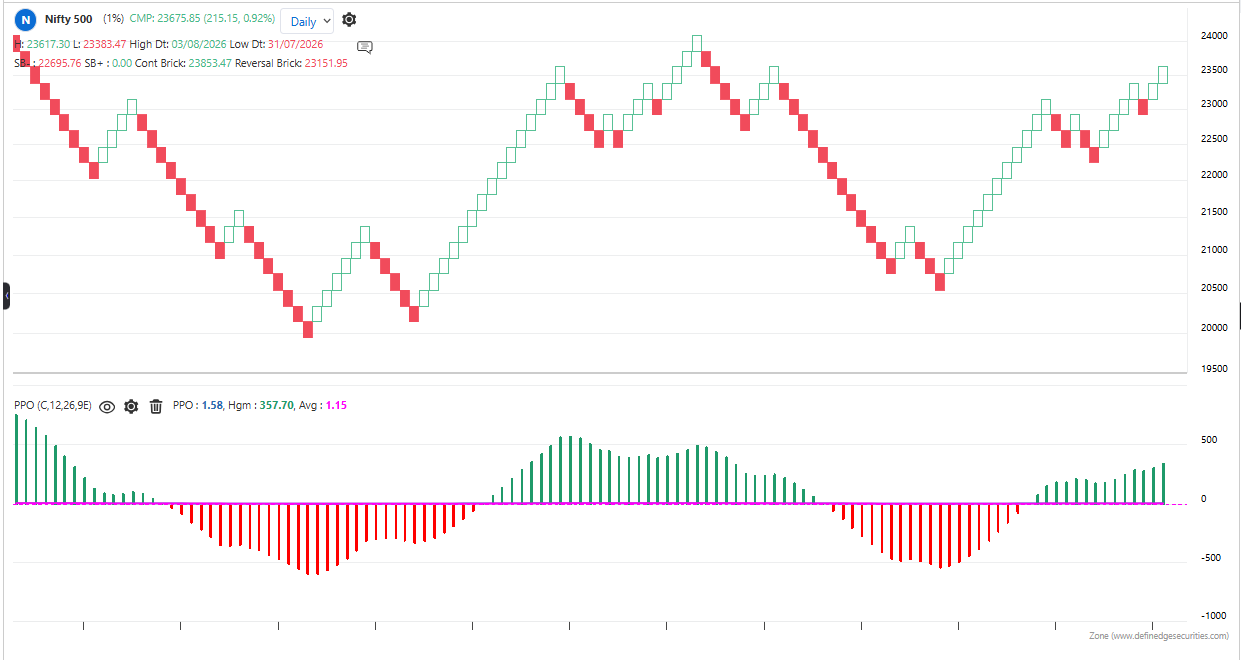
The indicator is applicable to all types of charting. It is calculated based on the number of columns on P&F charts, bricks on Renko charts, lines on Line-break charts, candles on Heikin-Ashi charts, and lines on Kagi charts. While the formula and reading of the indicators remain the same, they become more dynamic on these charts.