Customer Support : 020-61923200, [email protected] | Call and Trade : 020-61923220

Vortex Indicator
#trendfollowing #directional
Inventor: Etienne Botes and Douglas Siepman
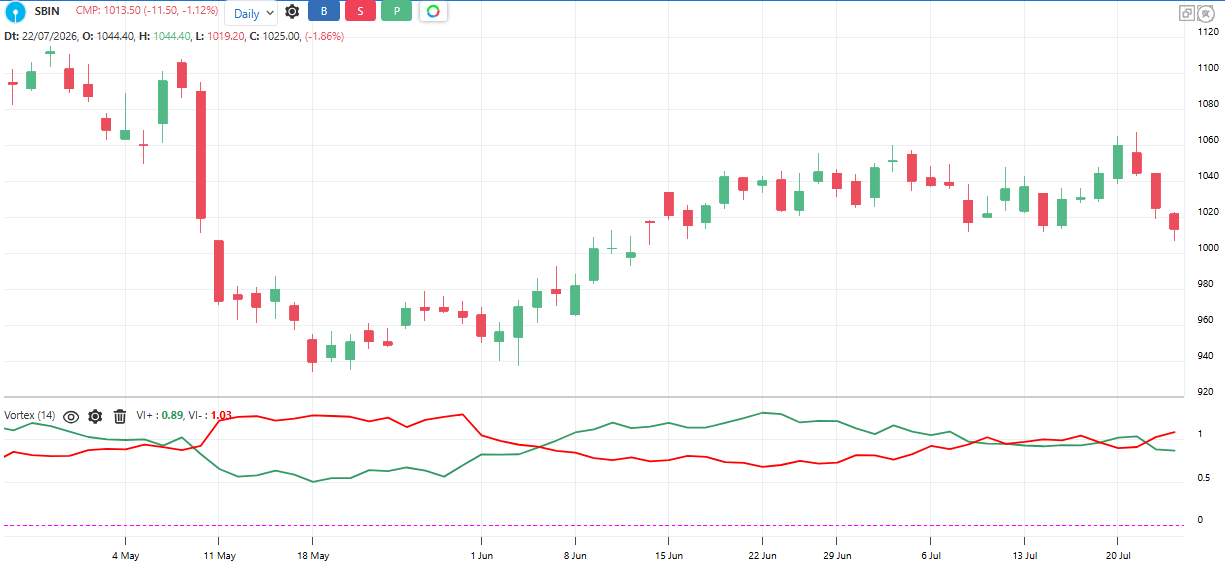
Measures upward and downward trend movement as two lines. VI+ grows when today’s high stretches far above yesterday’s low (upward vortex); VI- grows when today’s low stretches far below yesterday’s high (downward vortex). Both are normalized by True Range. The line on top shows which direction controls the trend.
Default period: 14
VI+ above VI- indicates uptrend in control. VI- above VI+ indicates downtrend in control.
Useful readings:
VI+ crosses above VI-: Trend turned up
VI- crosses above VI+: Trend turned down
Wide gap between the lines: Strong one-sided trend
Lines braiding around each other: Sideways market, crossings unreliable
VI+ making higher peaks: Uptrend strengthening
Similar job to the DMI lines of ADX, with earlier but noisier crossings
Objective rules:
Bullish: VI+ crosses above VI-.
Bearish: VI- crosses above VI+.
Strength filter: Take the cross only if the crossing line is above 1.0
Long exit: VI- crosses back above VI+
Chop filter: Skip signals if the lines crossed more than twice in last 15 bars
What makes it unique:
It models trend as two competing vortices, measuring upward and downward stretch separately before comparing them. Its crossings often arrive earlier than the DMI crossings of the same family.
The indicator table value in TradePoint & RZone also provides you with a list of all values of this indicator for any group of stocks. This will allow you to compare the readings of this indicator across different stocks.
The indicator is applicable to all types of charting. Calculated based on the number of columns on P&F charts, bricks on Renko charts, lines on Line-break charts, candles on Heikin ashi charts, and lines on Kagi charts. While the formula and reading of the indicators remain the same, they become more dynamic on these charts.
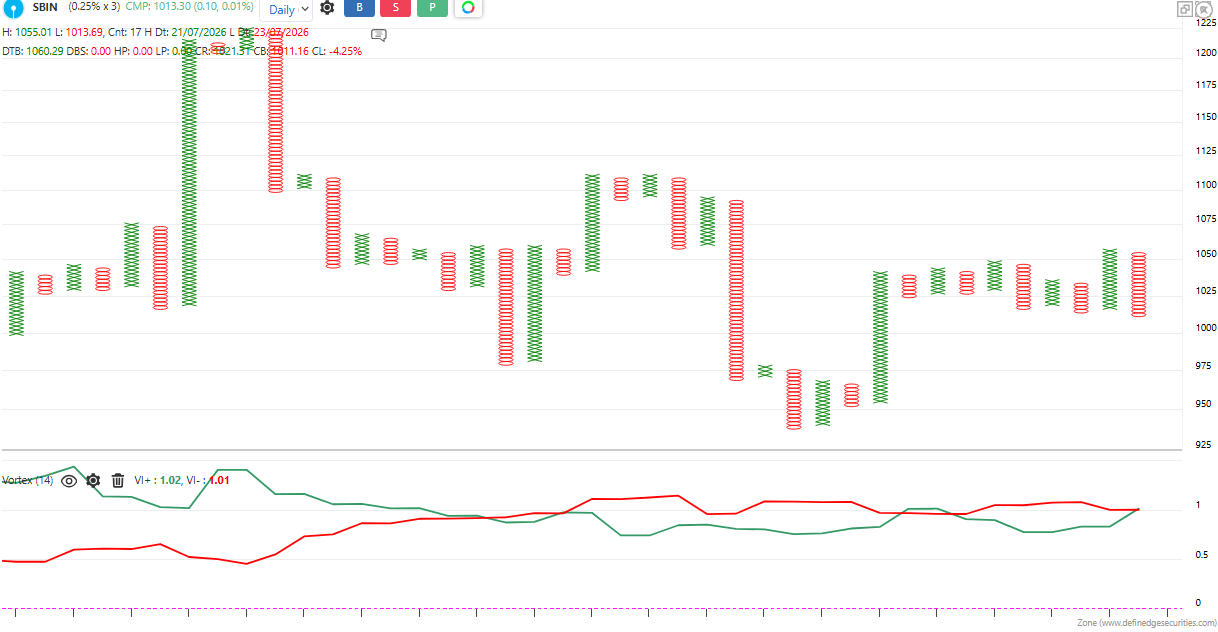
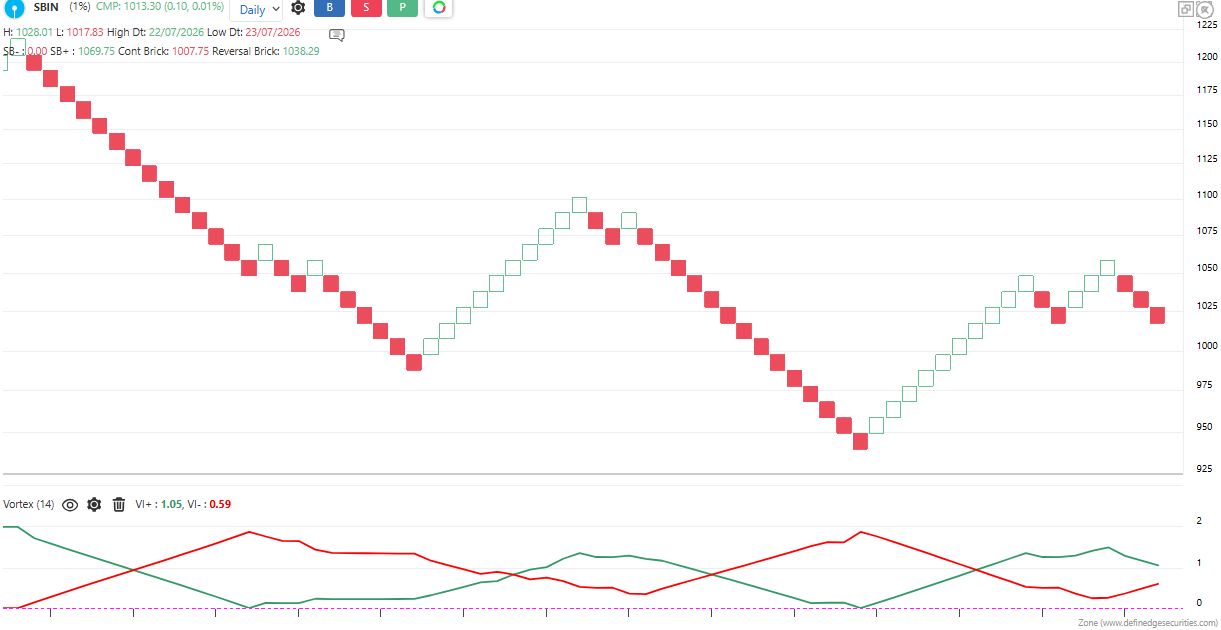
This indicator is also available in the System Builder of RZone & TradePoint for all charting methods. Using the system builder, you can develop various strategies based on the different conditions already present in this indicator. Additionally, it can be used with other indicators or price patterns to develop effective trading strategies. For any group of stocks and market segments, you can scan and backtest stocks based on those strategies.