Customer Support : 020-61923200, [email protected] | Call and Trade : 020-61923220

WilliamR
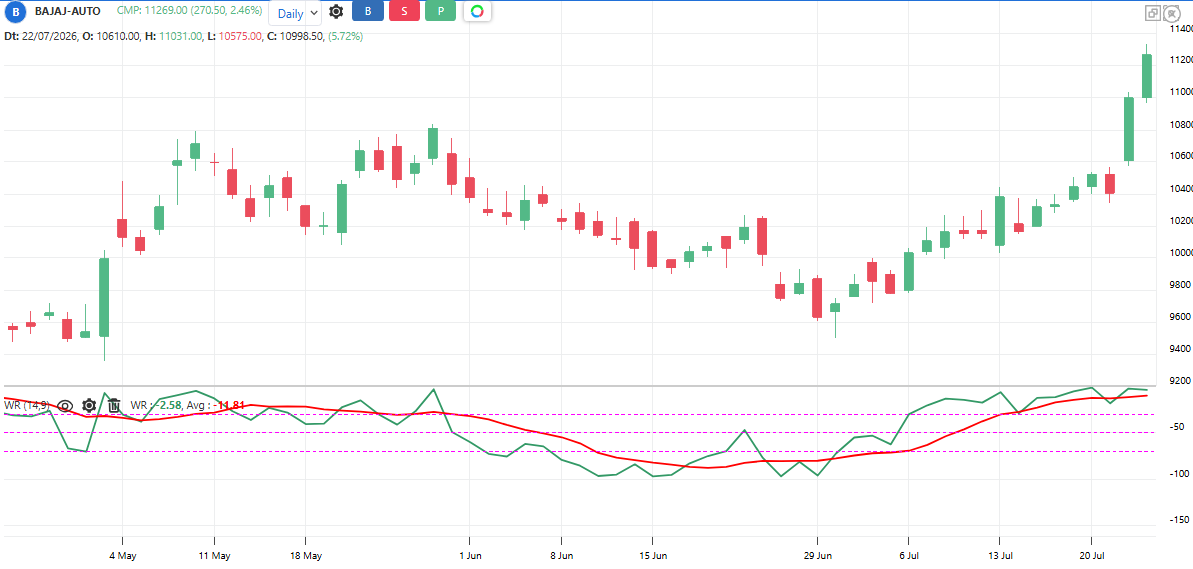
#momentum #oscillator #overboughtoversold
Creator: Larry Williams
William % R is a momentum indicator.
- William % R indicator
- Average line of the William % R
Default period: 14 (Williams originally used 10)
The indicator has an inverse and negative scale. It is the mirror twin of the Stochastic %K line, just drawn upside down and without smoothing, so it reacts instantly. The William %R indicator moves between 0 and -100.
Useful readings:
Above -20: Overbought zone
Below -80: Oversold zone
Rises out of the oversold zone: Bounce starting
Falls out of the overbought zone: Pullback starting
Stays pinned above -20 for many bars: Very strong uptrend, do not short it blindly
Stays pinned below -80: Very strong downtrend, do not buy blindly
Unsmoothed and jumpy; always pair with a trend filter
Objective rules:
Bullish: %R crosses above -80 from below.
Bearish: %R crosses below -20 from above.
Trend filter: In an uptrend (price above 200 SMA) take only the bullish signals; in a downtrend only the bearish ones
Long exit: %R reaches above -20 and then turns down
Strength note: %R pinned above -20 while trend rises is strength, not an automatic sell
What makes it unique:
It is the fastest of the classic oscillators – raw, unsmoothed range position, reacting the same bar. Williams designed it jumpy on purpose; the speed is the feature.
The indicator table value in TradePoint & RZone also provides you with a list of all values of this indicator for any group of stocks. This will allow you to compare the readings of this indicator across different stocks.
This indicator is also available in the System Builder on RZone & TradePoint for all charting methods. Using the system builder, you can develop various strategies based on the different conditions already present in this indicator. Additionally, it can be used with other indicators or price patterns to develop effective trading strategies. For any group of stocks and market segments, you can scan and backtest stocks based on those strategies.
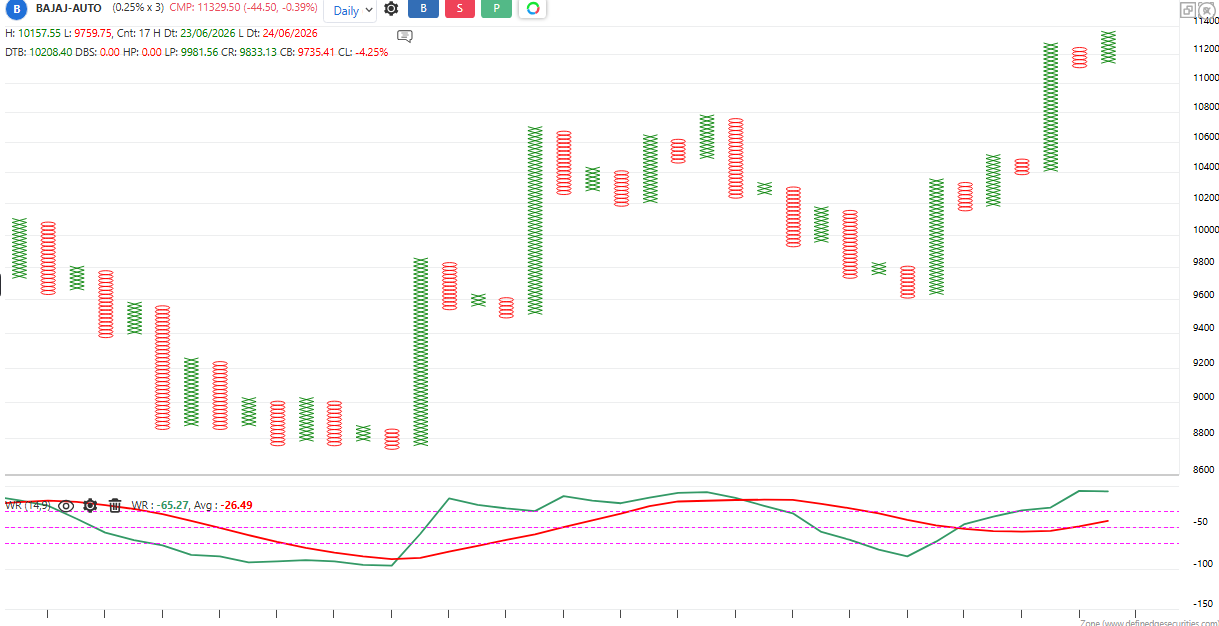
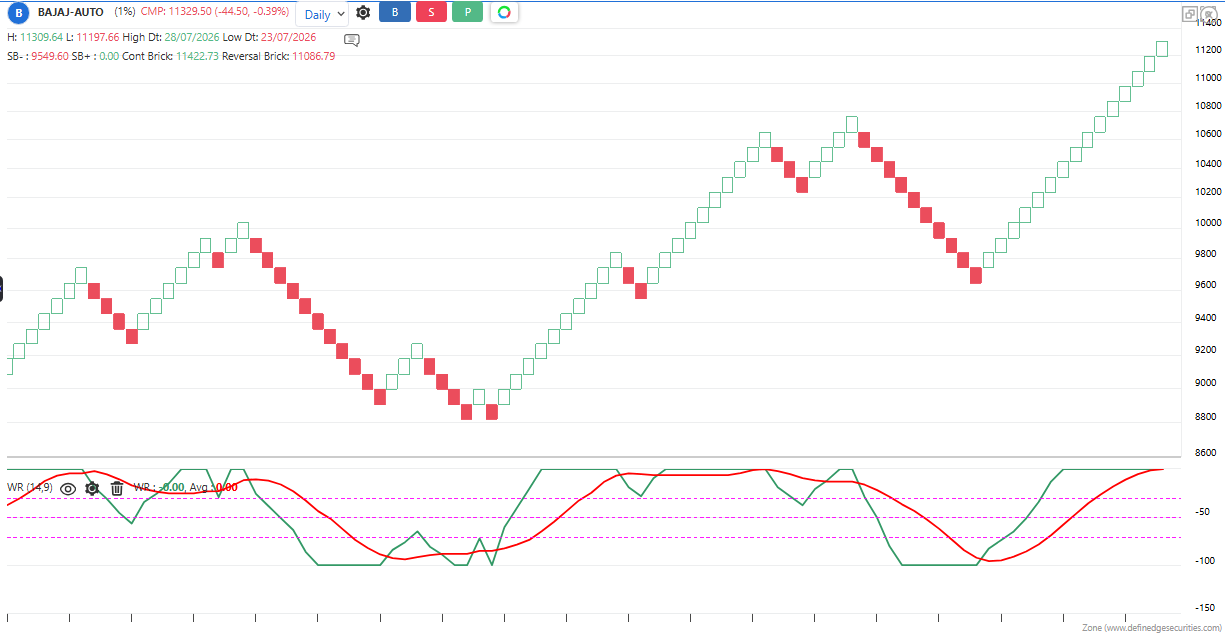
The indicator is applicable to all types of charting. It is calculated based on the number of columns on P&F charts, bricks on Renko charts, lines on Line-break charts, candles on Heikin-Ashi charts, and lines on Kagi charts. While the formula and reading of the indicators remain the same, they become more dynamic on these charts.