Customer Support : 020-61923200, [email protected] | Call and Trade : 020-61923220

Elder Impulse System
#trendfollowing #momentum #system
Inventor: Dr. Alexander Elder
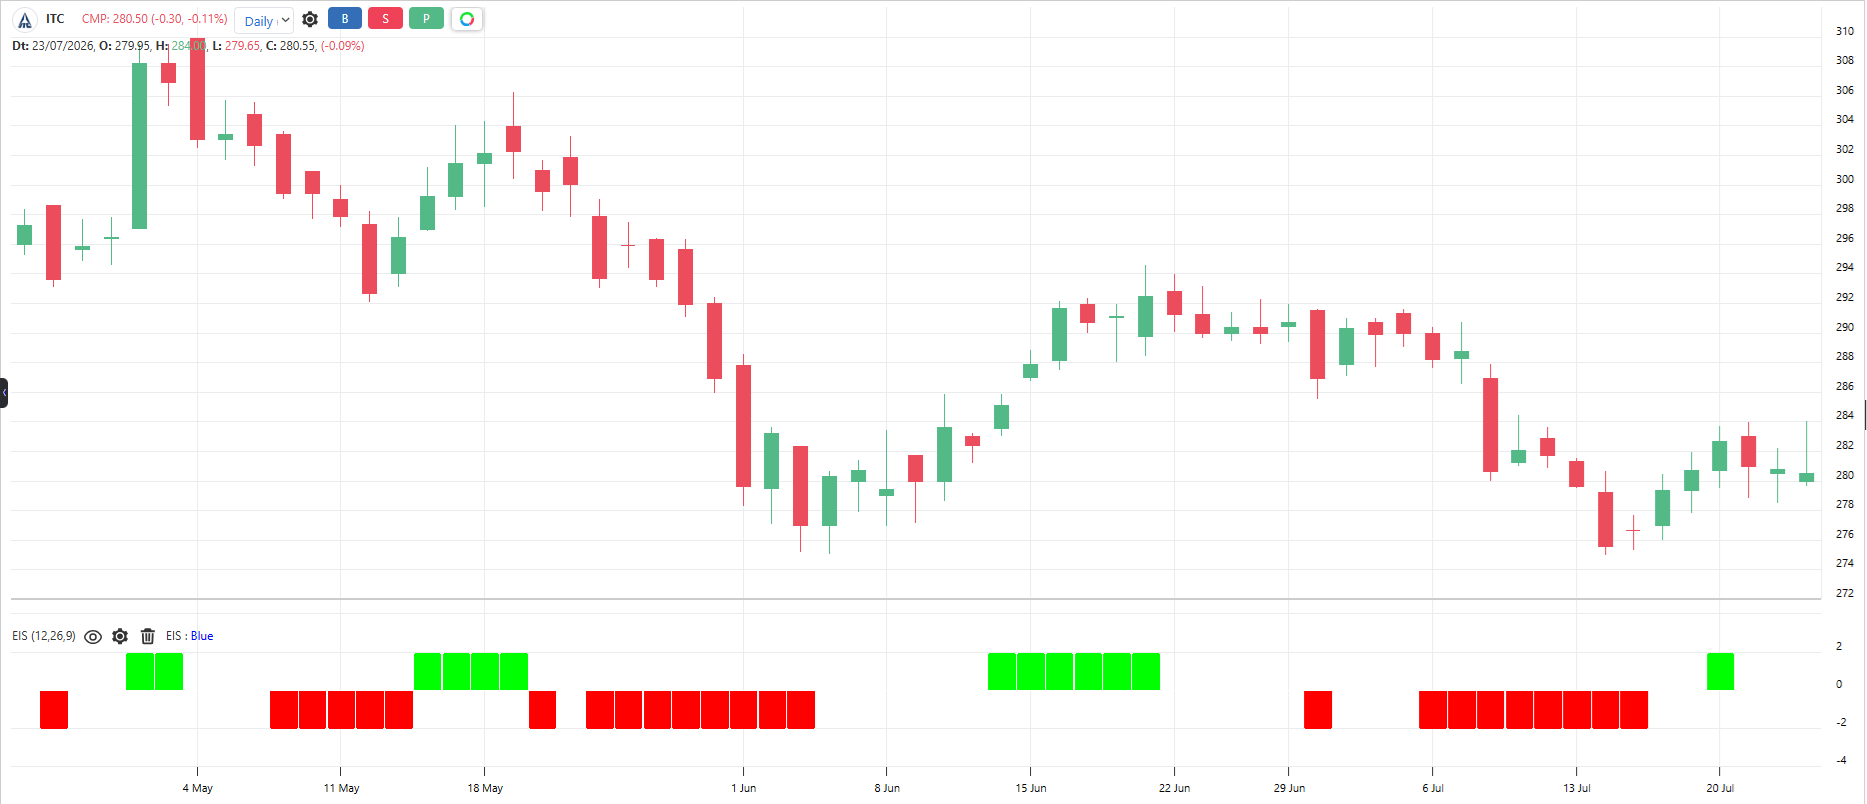
Created by Dr. Alexander Elder. It colors each price bar by combining trend and momentum: the slope of the 13 EMA (trend) and the slope of the MACD histogram (momentum). Green bar = both rising, buyers fully in charge. Red bar = both falling, sellers fully in charge. Blue bar = mixed signals, no one in charge.
Default period: 13 EMA and MACD 12, 26, 9
Green bars indicate you may buy or stand aside, but not short. Red bars indicate you may short or stand aside, but not buy. Blue bars allow both.
Useful readings:
String of green bars: Strong uptrend, hold longs
String of red bars: Strong downtrend, hold shorts
Green turning blue: Uptrend losing one engine, tighten stops
Red turning blue: Downtrend losing one engine, shorts tighten stops
Blue turning green after a dip: Buyers restarting, entry window
Rapid color flipping: Choppy market, stand aside
Objective rules:
Bullish: Bar turns green (13 EMA rising AND MACD histogram rising).
Bearish: Bar turns red (13 EMA falling AND MACD histogram falling).
Permission rule: Never buy on a red bar, never short on a green bar
Entry rule: Buy when color changes from red or blue to green; short when it changes to red
Exit long: First red bar after a green run
What makes it unique:
It works as a censorship system, not a signal system – it tells you what you are forbidden to do. Painting trend plus momentum onto each bar makes discipline visible.
Click here to know more about Elder Impulse System.
The indicator table value in TradePoint & RZone also provides you with a list of all values of this indicator for any group of stocks. This will allow you to compare the readings of this indicator across different stocks.
This indicator is also available in the System Builder of RZone & TradePoint for all charting methods. Using the system builder, you can develop various strategies based on the different conditions already present in this indicator. Additionally, it can be used with other indicators or price patterns to develop effective trading strategies. For any group of stocks and market segments, you can scan and backtest stocks based on those strategies.
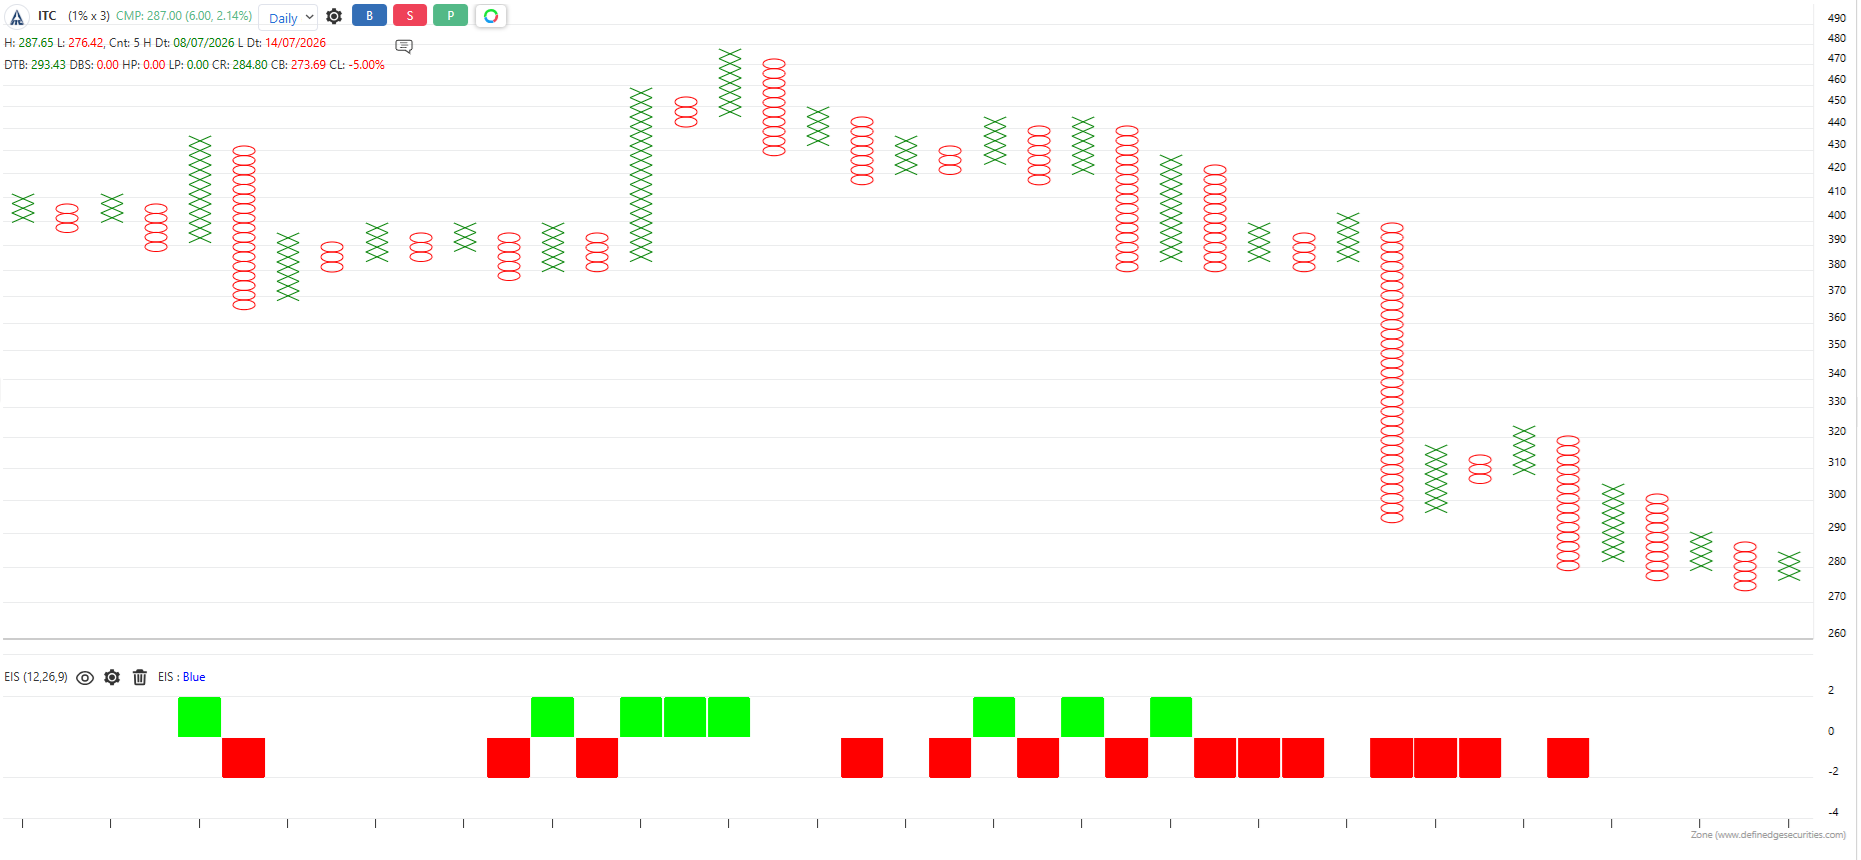
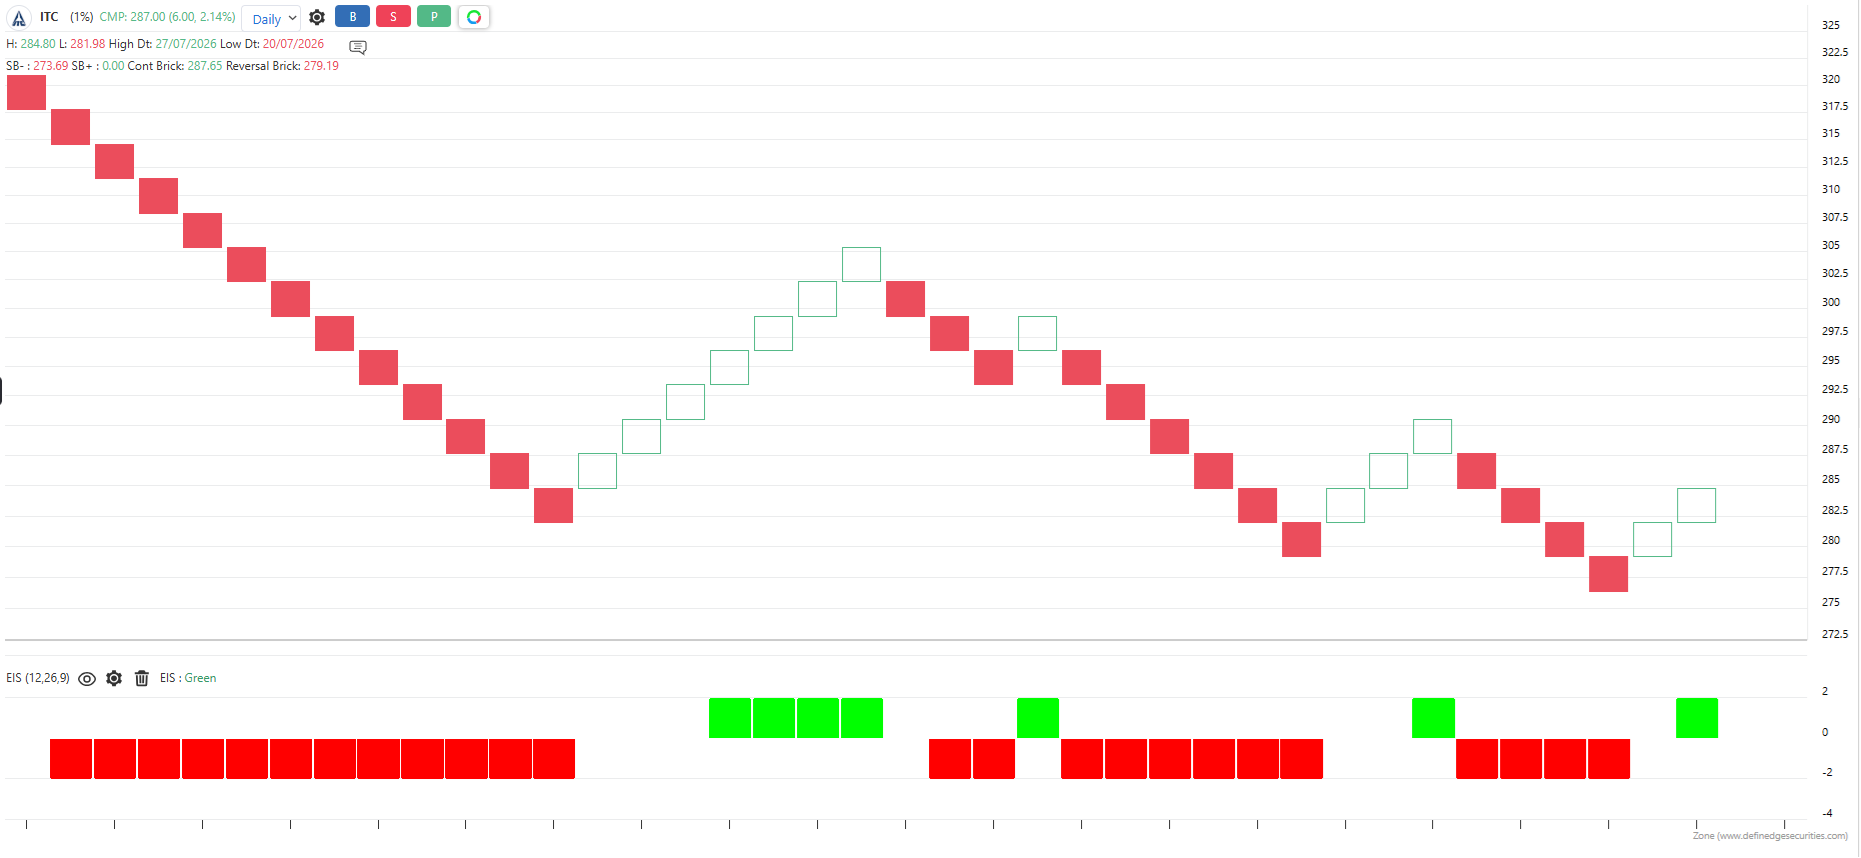 The indicator is applicable to all types of charting. Calculated based on the number of columns on P&F charts, bricks on Renko charts, lines on Line-break charts, candles on Heikin ashi charts, and lines on Kagi charts. While the formula and reading of the indicators remain the same, they become more dynamic on these charts.