Customer Support : 020-61923200, [email protected] | Call and Trade : 020-61923220
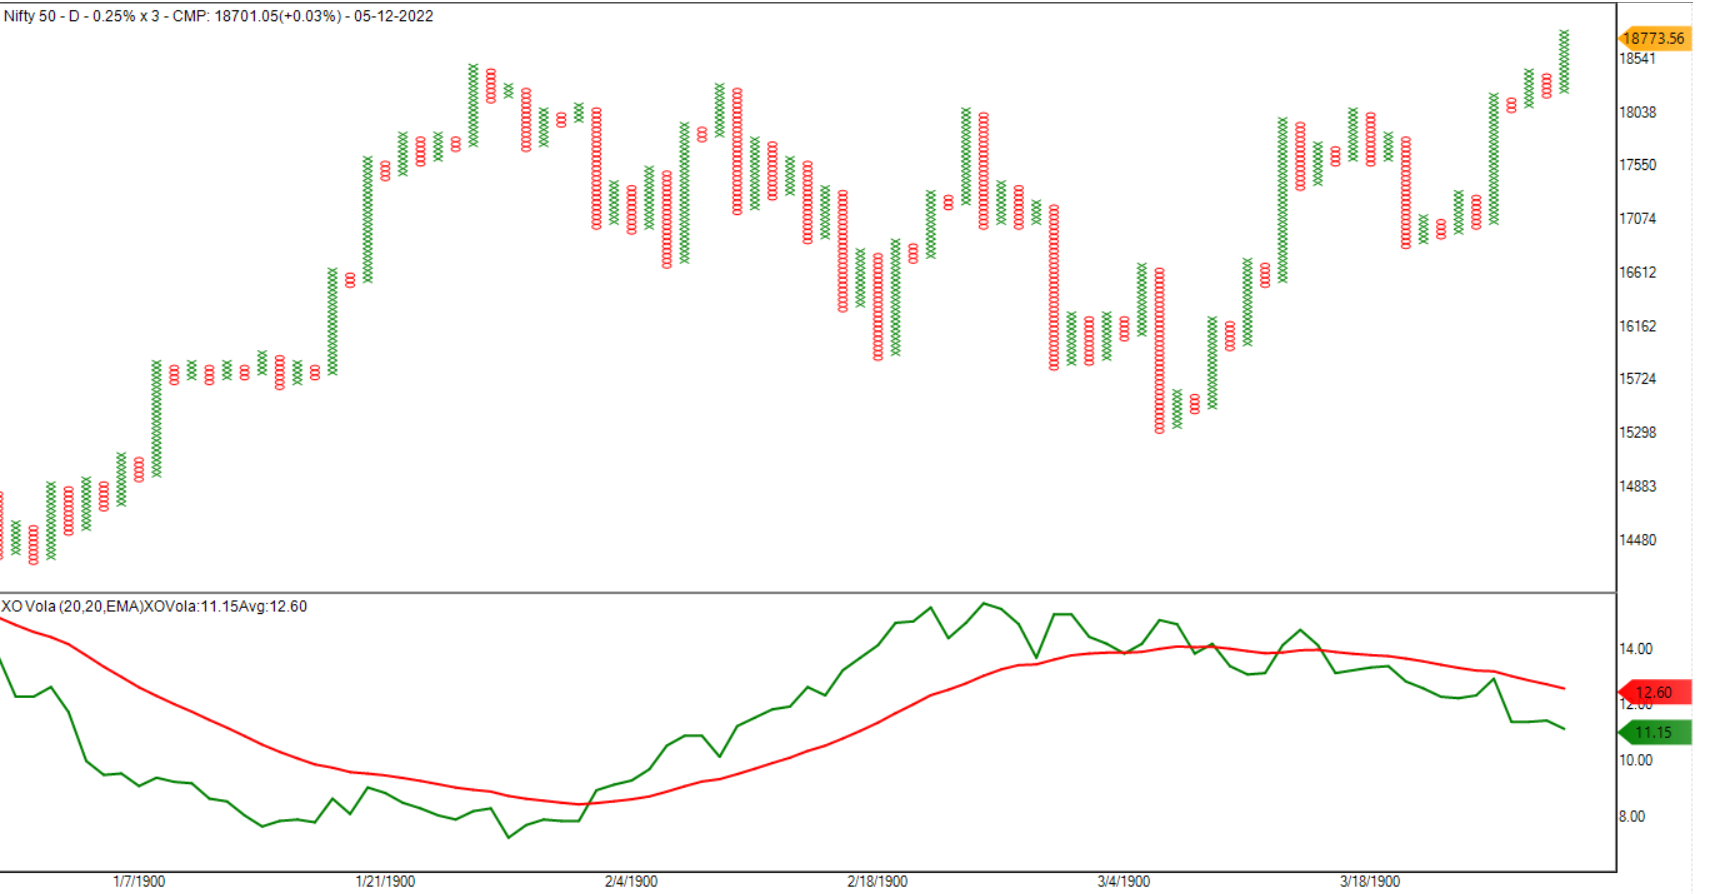
XO Volatility
Creator : Definedge
The XO Volatility indicator is a point-and-figure chart indicator developed by Prashant Shah.
The indicator is designed using the X, O, and vertical column properties of the Point & Figure chart.
XO Volatility measures price volatility, as its name suggests.
For this indicator, volatility is calculated based on the number of X’s and O’s instead of price.
An “X” represents a bullish print on a P&F chart, whereas an “O” represents a bearish print.
Therefore, it becomes the P&F universe’s volatility indicator.
The XO Volatility indicator above its average line indicates that column volatility is increasing. Volatility indicator XO below its average line suggests that the trend is getting stronger.
When the XO Volatility indicator is below its average line, riding the trend with simple double bottom sell signals or moving averages is more likely to be successful. Conversely, when the XO Volatility indicator is above its average line, aggressive exits may prove more profitable since large columns may appear with no clear trend.
The indicator table value in TradePoint & RZone also provides you with a list of all values of this indicator for any group of stocks. This will allow you to compare the readings of this indicator across different stocks.
This indicator is also available in the System Builder on RZone & TradePoint. Using the system builder, you can develop various strategies based on the different conditions already present in this indicator. Additionally, it can be used with other indicators or price patterns to develop effective trading strategies. For any group of stocks and market segments, you can scan and backtest stocks based on those strategies.