Customer Support : 020-61923200, [email protected] | Call and Trade : 020-61923220

Triple Exponential Moving Average (TEMA) Indicator
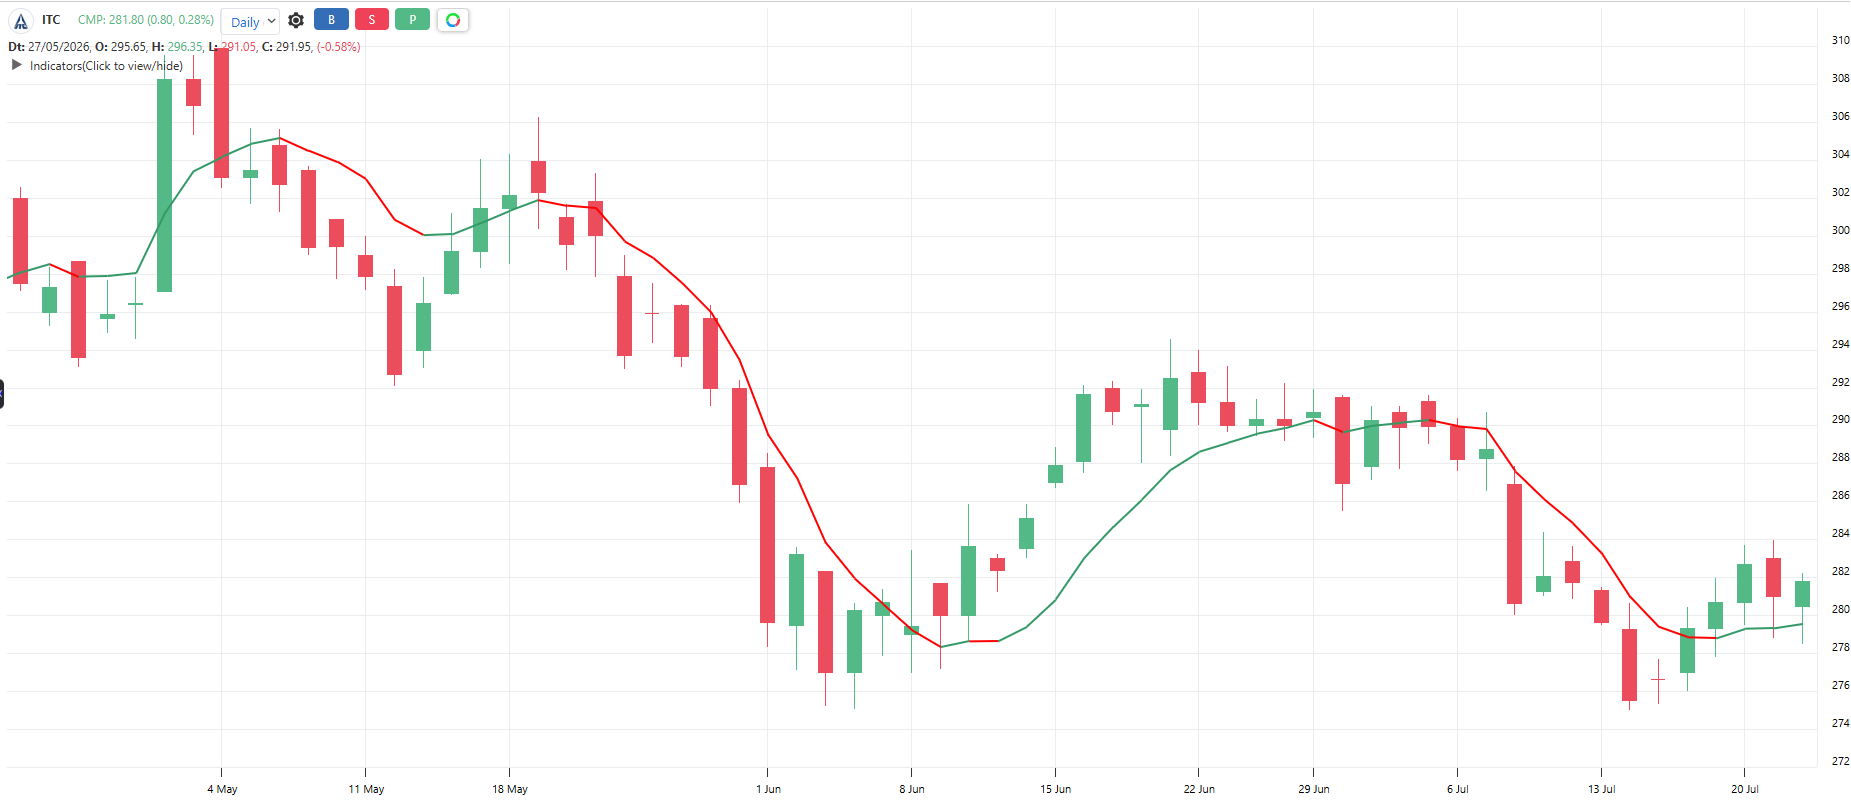
#trendfollowing #movingaverage #lowlag
Inventor: Patrick Mulloy
The next step after DEMA. It applies the lag-cutting trick one level deeper, using the EMA, the EMA of the EMA, and the EMA of that, combined to cancel most of the delay. The result hugs price even tighter than DEMA and turns even earlier – and gives even more false turns in sideways markets. Speed order: EMA (slowest), DEMA, TEMA (fastest).
Default period: 20 (also 9 for fast, 50 for slow)
Rising TEMA indicates uptrend. Falling TEMA indicates downtrend. Its turns come earliest among the common moving averages.
Useful readings:
Price above rising TEMA: Uptrend running
Price below falling TEMA: Downtrend running
TEMA turns direction: Earliest MA-based warning of a trend change
TEMA slope steepening: Move accelerating
TEMA weaving flat through price: Sideways market, its speed becomes a trap, stand aside
Pair the fast turns with a slower filter (50 TEMA or 200 SMA) to survive chop
Objective rules:
Bullish: Price closes above TEMA and TEMA is rising.
Bearish: Price closes below TEMA and TEMA is falling.
Crossover system: Buy when 20 TEMA crosses above 50 TEMA, sell when it crosses below
Trend filter: Take longs only when price is above 200 SMA, shorts only when below
Chop filter: Skip signals if TEMA changed direction more than twice in last 10 bars
What makes it unique:
It pushes the de-lagging mathematics one level beyond DEMA, making it the fastest of the classic engineered averages. Speed is its identity and its risk.
The indicator table value in TradePoint & RZone also provides you with a list of all values of this indicator for any group of stocks. This will allow you to compare the readings of this indicator across different stocks.
This indicator is also available in the System Builder on RZone & TradePoint for all charting methods. Using the system builder, you can develop various strategies based on the different conditions already present in this indicator. Additionally, it can be used with other indicators or price patterns to develop effective trading strategies. For any group of stocks and market segments, you can scan and backtest stocks based on those strategies.
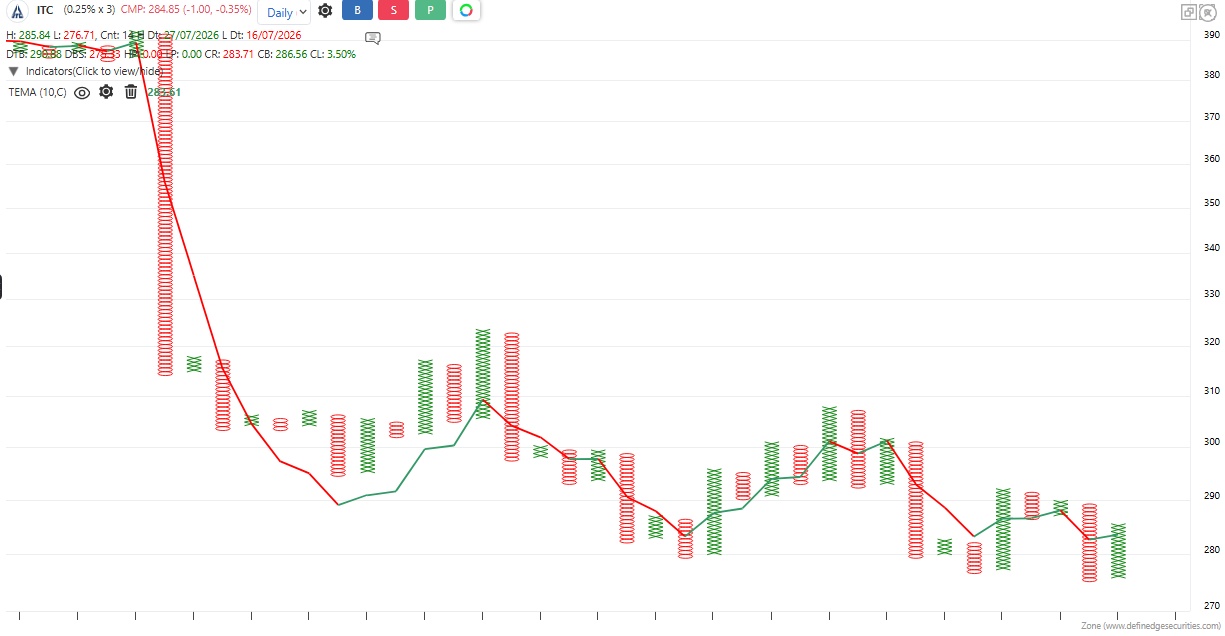
Default period: 10
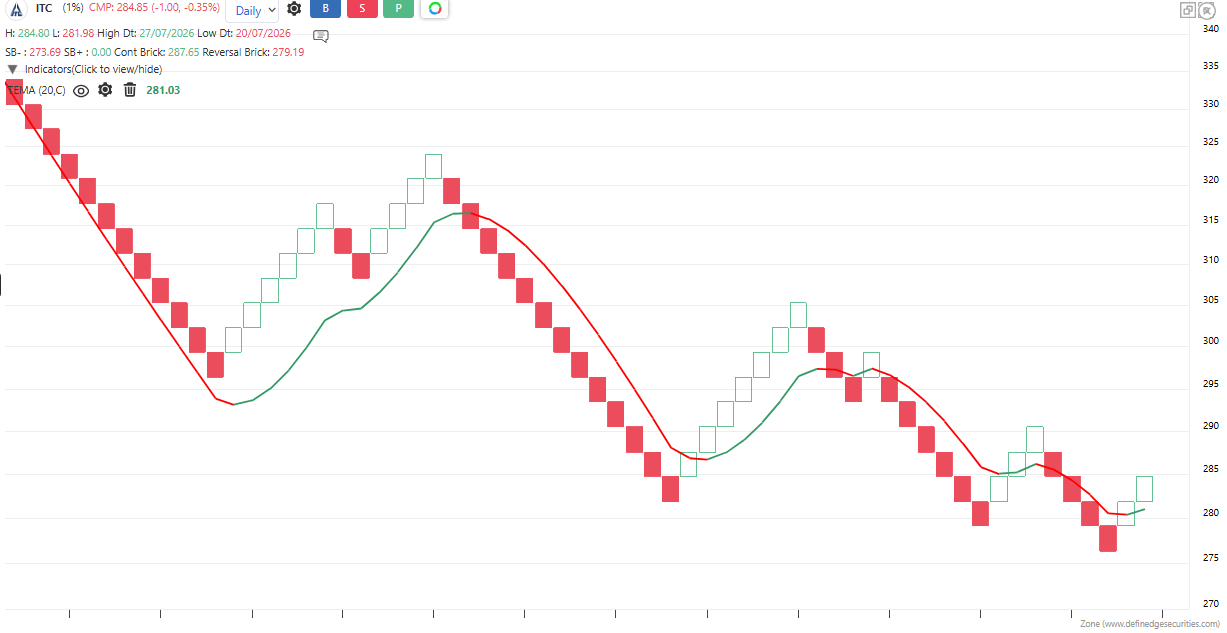
Default period: 20
The indicator is applicable to all types of charting. It is calculated based on the number of columns on P&F charts, bricks on Renko charts, lines on Line-break charts, candles on Heikin-Ashi charts, and lines on Kagi charts. While the formula and reading of the indicators remain the same, they become more dynamic on these charts.