Customer Support : 020-61923200, [email protected] | Call and Trade : 020-61923220

Return-Range(RRI)
#return #range #normalized #oscillator
Creator: Definedge
Return-Range Indicator (RRI) is a momentum indicator that oscillates between 0 and 100.
Default period: 14
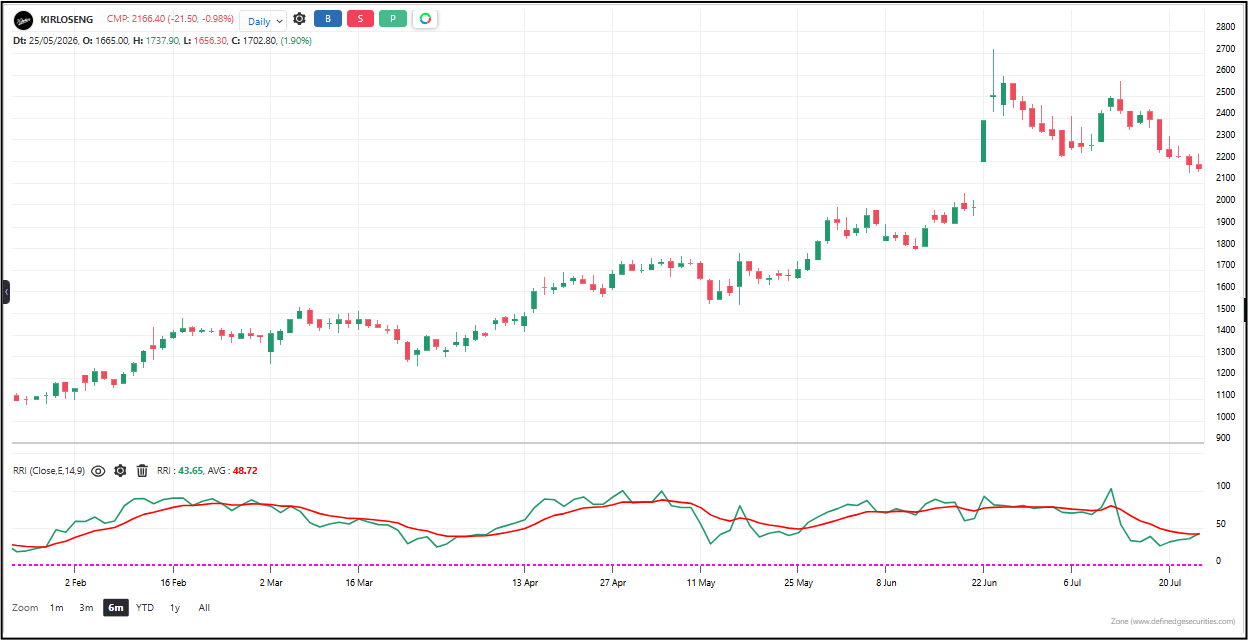
It calculates the returns (performance) and the range (volatility) during the user-defined period. When the price is near high and it is being reflected in performance, it is a sign of strong bullish momentum.
RRI indicator above 50 is bullish and RRI indicator below 50 is bearish. RRI above the moving average is bullish and RRI below the moving average is bearish. You can also read the divergences between price and RRI.
In addition, RRI can be used to rank stocks based on their trend and momentum. A higher RRI indicator reading indicates bullish behavior, while a lower RRI indicator reading indicates bearish activity.
How to read it:
An oscillator that moves between 0 and 100, centered around 50. Above 50 means the return is positive relative to the range — the market is moving directionally with purpose. Below 50 means the return is negative relative to the range — the market is drifting or falling. The further from 50, the stronger the directional bias.
Useful readings:
– Above 70 — the return is strong relative to the range. The market is moving cleanly in one direction. Very bullish.
– Below 30 — the return is weak relative to the range. The market is drifting or falling. Very bearish.
– Crossing above 50 — directional bias is turning positive. The market is starting to move with purpose.
– Crossing below 50 — directional bias is turning negative. The market is losing direction.
– Near 50 — the return is roughly equal to the range. The market is balanced, no clear direction.
– Rising from lows — the market is becoming more directional. A trend may be starting.
– Falling from highs — the market is becoming less directional. A trend may be ending.
Use cases:
– Trend quality filter: Only trade when RRI is above 50 (for longs) or below 50 (for shorts). When RRI is near 50, the market is choppy and trends will fail.
– Momentum confirmation: Rising RRI confirms the trend is healthy — the return is growing relative to the range. Falling RRI warns the trend is weakening.
– Breakout quality: A breakout with rising RRI is a real breakout — the move is clean and directional. A breakout with falling RRI is suspect — the move is noisy and may reverse.
– Reversal warning: When price makes a new high but RRI doesn’t, the new high isn’t backed by clean directional movement. The trend is hollow.
Objective rules:
– Go long when RRI crosses above 50 from below.
– Go short when RRI crosses below 50 from above.
– Exit when RRI crosses back through 50 in the opposite direction.
– Avoid trading when RRI is stuck near 50 — the market has no directional bias.
– Use extreme readings (above 80 or below 20) as warning signs — the move may be overextended.
What makes it unique: Most momentum indicators measure return in isolation. The RRI knows that a 5% return means something different if the range was 6% (clean move) versus 50% (noisy move). By normalizing return against the range, the RRI tells you whether the move is genuine or just noise. It answers: “Is this trend real, or is the market just running around in circles?”
The indicator table value in TradePoint & RZone also provides you with a list of all values of this indicator for any group of stocks. This will allow you to compare the readings of this indicator across different stocks.
This indicator is also available in the System Builder of RZone & TradePoint for all charting methods. Using the system builder, you can develop various strategies based on the different conditions already present in this indicator. Additionally, it can be used with other indicators or price patterns to develop effective trading strategies. For any group of stocks and market segments, you can scan and backtest stocks based on those strategies.
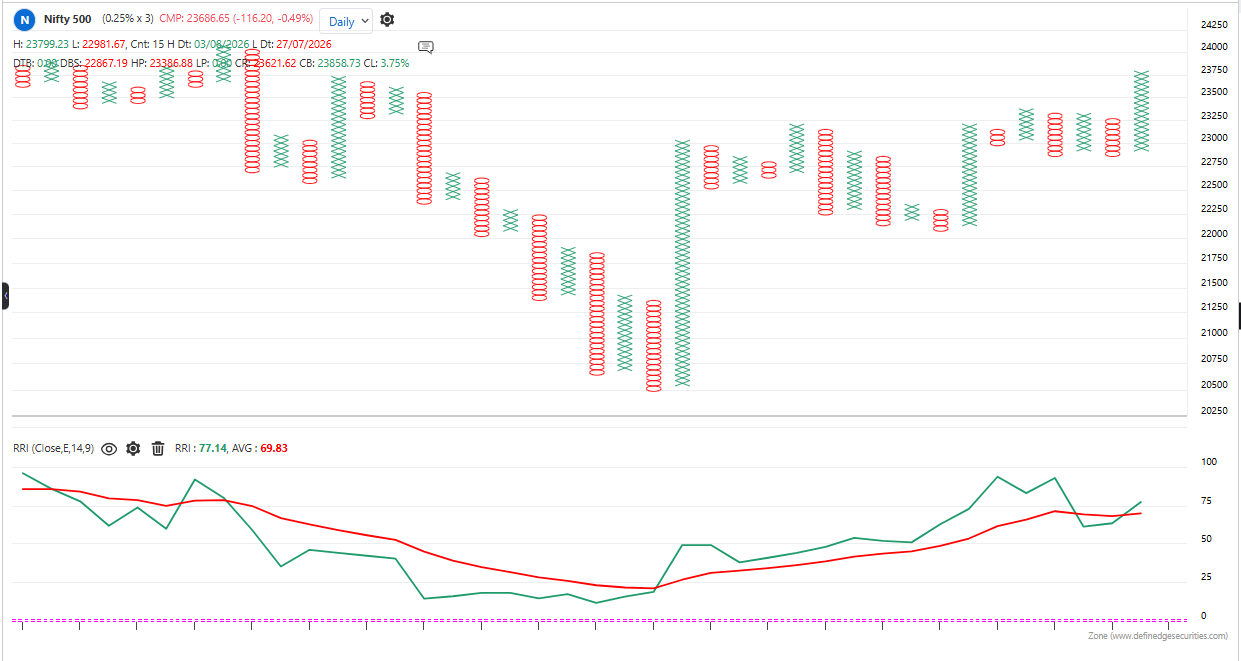
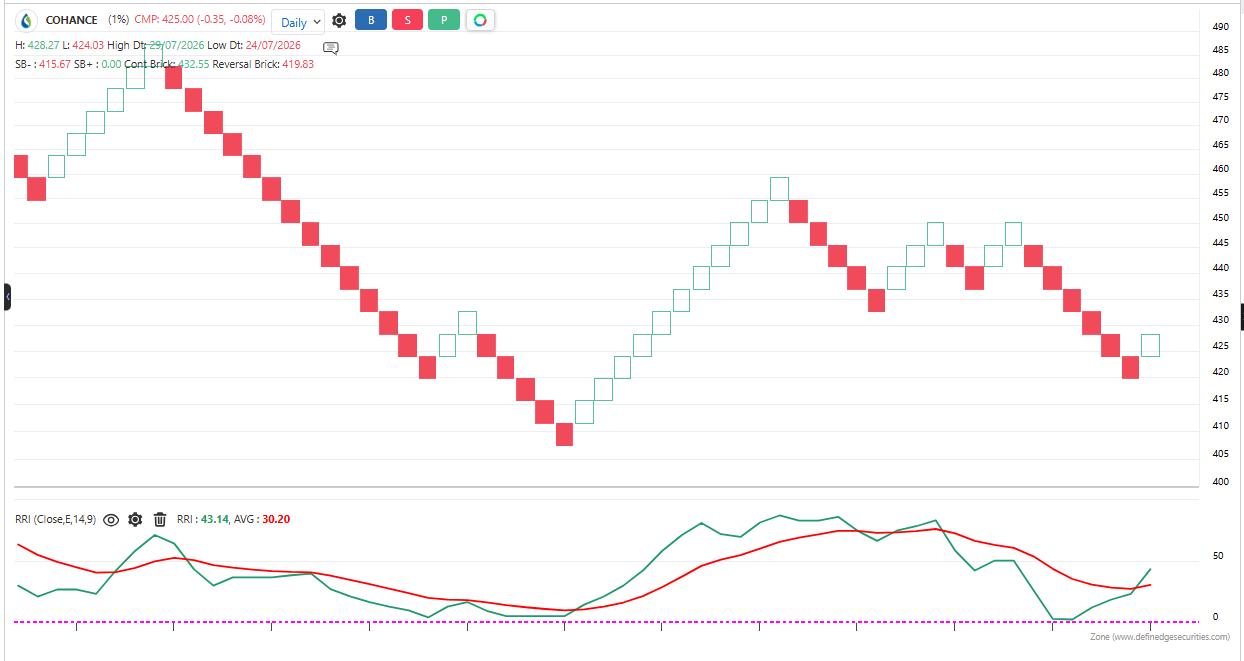
The indicator is applicable to all types of charting. Calculated based on the number of columns on P&F charts, bricks on Renko charts, lines on Line-break charts, candles on Heikin ashi charts, and lines on Kagi charts. While the formula and reading of the indicators remain the same, they become more dynamic on these charts.