Indicators

Accumulation And Distribution Line
Adaptive Moving Average (AMA)
Adaptive TSI
ADR
ADX
Alligator
AMMA Indicator
Aroon Indicator
Aroon Oscillator Indicator
ATR Based SMA Indicator
ATR Deviation Ranking
ATR Percentile Indicator
ATR Rank Indicator
ATR Stop-loss Indicator
ATR%
Average Column Length
Average Return
Average Trend
Average True Range [ATR]
Awesome Oscillator
Balance of Power
BBA Volatility Squeeze
BCI Indicator
Bollinger Band
Bollinger Band Size
Bollinger Bandwidth
Bollinger BTV
Brick Count Indicator
Brick Indicator
Brick Zone
Bull Bear Session counter
CAGR
Camarilla levels
Candlestick Momentum Index [CMI]
Center Of Gravity
Chaikin Volatility
Chande Kroll Stop
Chande Momentum Oscillator (CMO)
Chikou Span
Choppiness Index Indicator
CMB Composite index
CMIT
Column Length
Commodity Channel Index (CCI)
Connors RSI
Coppock Indicator
Count-Moving Average Indicator
CRSI
D Adaptive RSI Indicator
D Cap-Shoe RS Indicator
D Disparity Dots – D Smart
D Disparity Dots – Super trend
D Momentum Pullback
D Momentum Pullback Indicator
D Smart Line
D-Disparity Dots Indicator
DCA Volatility Squeeze indicator
DEMA
Detrend Price Oscillator (DPO)
Discrete Moving Average
Disparity Index
DMA histogram
Donchian Bandwidth
Donchian Channel
Double Moving Average
Double Vwap
DTDB Indicator
Ease of Movement
Efficiency
Efficiency Ratio
Elder Impulse System
Elder Ray Index
Force Index
Forward Displaced Moving Average
Fresh vs Running
Gain Loss Count Indicator
GAPO Indicator
Guppy Multiple Moving Average
High Low Indicator
High Low Momentum Index
High Low Retracement
Hull Moving Average
Ichimoku
Intra VWAP
Intra VWAP Disparity Index
Intra VWAP Histogram
Intrady Momentum Index[IMI]
Keltner ATR
Keltner Channel
King Oscillator
KST
MA Envelope
MA Score Indicator
MACD
MACD Histogram
MACD_V
MACD% Indicator
MACI (MA Convergence)
Mansfield Relative Strength
Mass Index
MAST Indicator
Money Flow Index [MFI]
Moving Average Channel
MP RSI
Multiple ROC%
Negative Volume Index (NVI)
No of days in P&F chart
Noise Rate Indicator
OIWAP (OI Weighted Average Price)
On Balance Volume (OBV)
Parabolic SAR
Percent Away From MA
Percent B Indicator
Percentage Price Oscillator (PPO)
Percentage Volume Oscillator (PVO)
Performance Indicator
PIVOT Indicator
PMO
PMOX Indicator
Price by time
Price Median
Price Rekha Indicator
Price Strength Index
QQE
Quality Action Indicator (QAI)
Range Marker
Rank Index
Ratio Chart
Ratio Rank Indicator
Ratio RSI Indicator
RAVI
RDX
Relative Strength - Alpha Vol
Relative Strength – Alpha
Relative Strength Index (RSI)
Return-Range(RRI)
RMI
ROC ABS
ROC%
Rohit’s Long Momentum Indicator
Rohit’s Momentum Indicator
Rohit’s Short Momentum Indicator
Rotation Factor
RS-NV
RS-TVR
RSI Cumulative Indicator
RSI Histogram
RSI Streak
RSI-sum indicator
RVOL-Relative Volume
Safe Zone
Senkou Span B
Shadow Rate Indicator (SRI)
Shadow%
Single Moving Average
Single VWAP
Smoothen Relative Strength Index (SRSI)
Smoother MA
Special K
Standard Deviation [SD]
Stochastic
Stochastic RSI
Stretch
Super Swing Line
Super Trend
Swing Line Indicator
Swing Price Volume Indicator
TEMA
TMA Trend
Triple Brick Indicator
Triple Moving Average
Triple Vwap
Triple XO Indicator
TRIX
True Strength Index (TSI)
TS 100
TTM Squeeze
Turtle Bands - Bearish
Turtle Bands - Bullish
Typical Price – Average
Ulcer Index
Ultimate Oscillator
US-LS
Volar indicator
Volatility
Volume
Volume Double Moving Average
Volume Rate of Change%
Vortex Indicator
VWAP ATR Bands
VWAP Bollinger Bands
Weighted Close
Weighted ROC
WilliamPro_Go
WilliamR
X Ratio
XO AMA
XO Count
XO Indicator
XO Line
XO Strength
XO Volatility
XO Zone
XO Zone with Average
Z Score

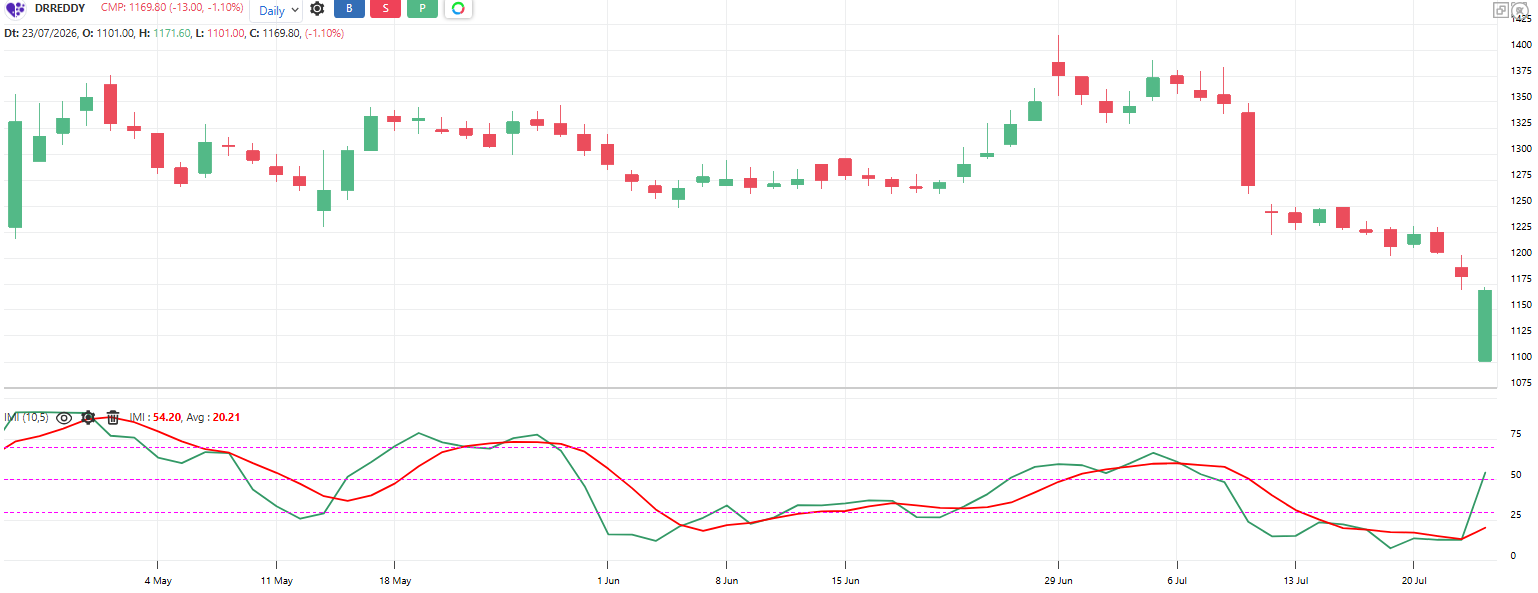
Intrady Momentum Index[IMI]

Screenshot 2026 07 23 161039

#momentum #oscillator #candlestick #overboughtoversold 

Inventor: Tushar Chande 

Tushar Chande’s blend of candlesticks and RSI. Instead of comparing close to previous close like RSI, it compares each bar’s close to its own open – the candle’s body. White candles (close above open) count as buying, black candles (close below open) count as selling, combined with the RSI formula over 10 bars. Moves between 0 and 100. 

Default period: 10 

Above 50 indicates white candles dominating, buyers winning the sessions. Below 50 indicates black candles dominating. 

Useful readings: 

IMI above 70: Overbought, sessions one-sidedly bullish, pullback risk 

IMI below 30: Oversold, sessions one-sidedly bearish, bounce likely 

IMI crossing above 50: Session control shifting to buyers 

IMI diverges from RSI: Candle bodies telling a different story than closes, worth attention 

Price makes new low but IMI does not: Bullish divergence, selling sessions weakening 

Popular among options traders for timing entries in range markets 

Objective rules: 

Bullish: IMI crosses above 30 from below. 

Bearish: IMI crosses below 70 from above. 

Trend filter: Take the oversold buy only when price is above 200 SMA; the overbought sell only below it 

Session shift rule: IMI crosses above 50 after being below 30, momentum recovery confirmed 

Exit: IMI reaches the opposite extreme zone 

What makes it unique: 

It applies RSI mathematics to candle bodies – close versus open – so it scores who won each session, not each day-to-day change. It is candlestick philosophy in oscillator form. 

The indicator table value in TradePoint & RZone also provides you with a list of all values of this indicator for any group of stocks. This will allow you to compare the readings of this indicator across different stocks.

This indicator is also available in the System Builder of RZone & TradePoint for all charting methods. Using the system builder, you can develop various strategies based on the different conditions already present in this indicator. Additionally, it can be used with other indicators or price patterns to develop effective trading strategies. For any group of stocks and market segments, you can scan and backtest stocks based on those strategies.
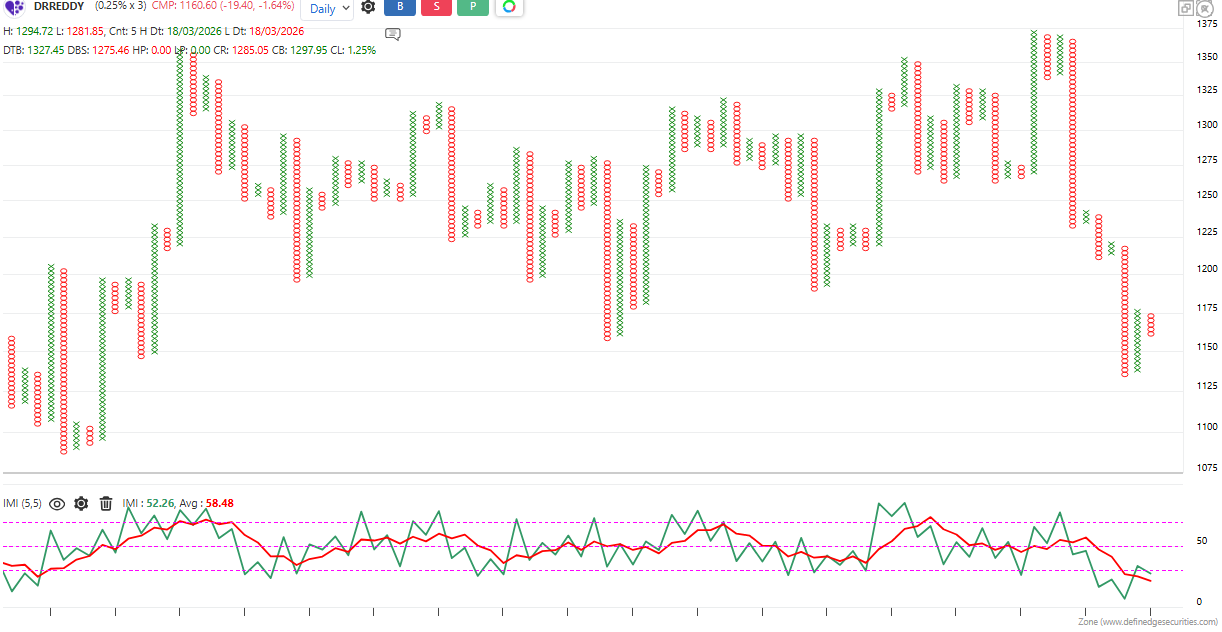
Default period: 5
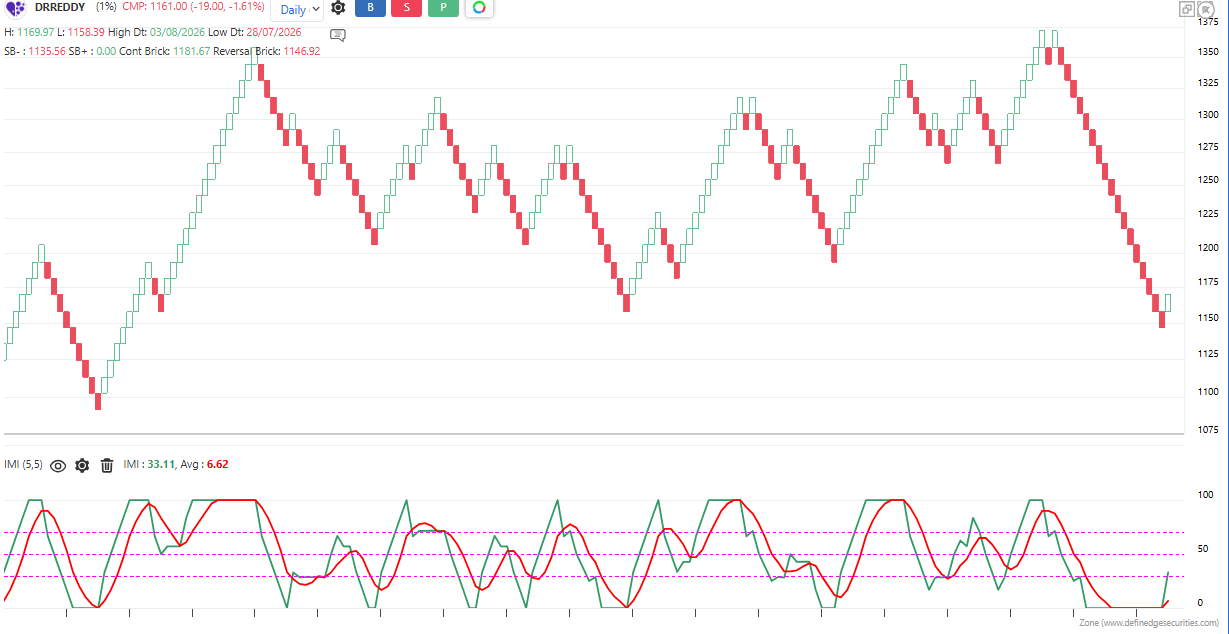
 

Default period: 5

The indicator is applicable to all types of charting. Calculated based on the number of columns on P&F charts, bricks on Renko charts, lines on Line-break charts, candles on Heikin ashi charts, and lines on Kagi charts. While the formula and reading of the indicators remain the same, they become more dynamic on these charts.

Open Demat Account