Customer Support : 020-61923200, [email protected] | Call and Trade : 020-61923220

Candlestick Momentum Index [CMI]
#momentum #range-normalized #candlestick #relative-strength
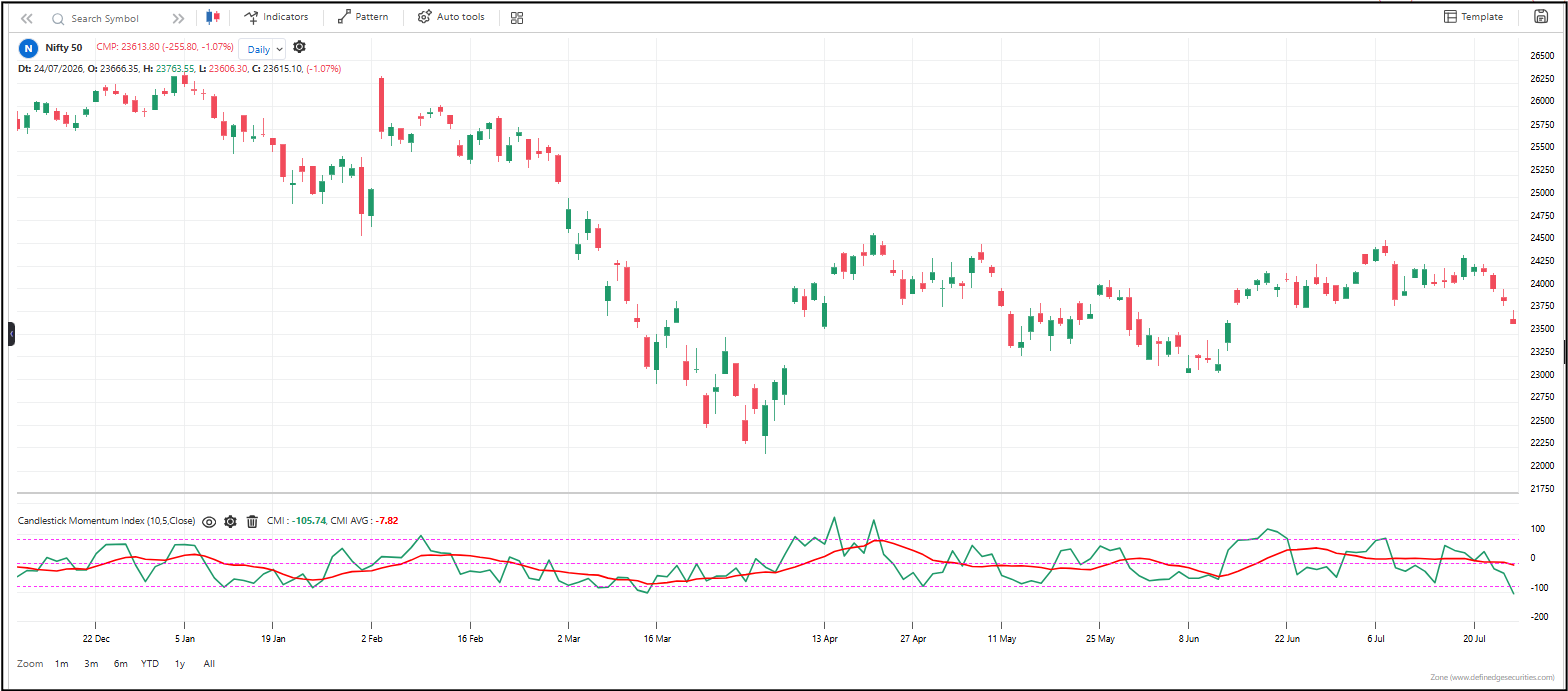
Candlestick Momentum Index (CMI) tells you whether price moves are large or small relative to the recent trading range. A 5-point move means nothing if the stock ranges 50 points a day. It means everything if the stock ranges 6 points. CMI puts price changes in context by comparing them to the recent high-low range. When CMI is high, moves are big relative to range — momentum is strong. When CMI is low, moves are small relative to range — momentum is weak.
Default parameters: 10, 5
How to read it:
A smooth line with an average line running alongside it. When CMI is above its average, price moves are larger than normal relative to the trading range — momentum is strong. When CMI is below its average, price moves are smaller than normal — momentum is weak. The average line is your baseline for “normal” momentum. Use the same signal conditions as the TSI indicator: crossovers, direction, and divergence.
Useful readings:
CMI above average — price moves are bigger than normal. Momentum is strong. The trend has fuel.
CMI below average — price moves are smaller than normal. Momentum is weak. The trend is losing energy.
CMI rising — momentum is building. Each move is bigger than the last relative to range.
CMI falling — momentum is fading. Each move is smaller than the last relative to range.
CMI crosses above average — momentum is turning from weak to strong. Bullish shift.
CMI crosses below average — momentum is turning from strong to weak. Bearish shift.
Divergence from price — price makes a new high but CMI doesn’t — the new high isn’t backed by proportionally large moves. Trend exhaustion.
Use cases:
Trend quality filter: Only trade when CMI is above its average. That means the trend is backed by moves that are large relative to the range. When CMI is below average, the trend is hollow.
Momentum confirmation: CMI rising confirms the trend is healthy. CMI falling warns the trend is weakening — even if price hasn’t turned yet.
Divergence trading: When price and CMI disagree, the trend is running on empty. That’s your early exit signal.
Cross-market comparison: CMI is range-normalized, so you can compare momentum across stocks with different price levels and volatilities. A CMI of 1.5 means the same thing whether the stock is ₹100 or ₹10,000.
Objective rules:
Go long when CMI crosses above its average line.
Go short when CMI crosses below its average line.
Exit when the cross reverses.
Avoid trading when CMI is flat below average — momentum is dead.
Use divergence as an early warning to tighten stops or exit.
What makes it unique: Most momentum indicators treat all price changes equally. CMI knows that a 5-point move in a narrow-range stock is huge, but the same 5-point move in a wide-range stock is noise. By normalizing momentum against the trading range, CMI gives you a fair comparison across any stock, any timeframe. It answers the question: “Is this move actually significant, or just normal noise?”
The indicator table value in TradePoint & RZone also provides you with a list of all values of this indicator for any group of stocks. This will allow you to compare the readings of this indicator across different stocks.
Using the system builder, you can develop various strategies based on the different conditions already present in this indicator. Additionally, it can be used with other indicators or price patterns to develop effective trading strategies. For any group of stocks and market segments, you can scan and backtest stocks based on those strategies.