Customer Support : 020-61923200, [email protected] | Call and Trade : 020-61923220

RAVI
#trendstrength #regime
Creator: Tushar Chande
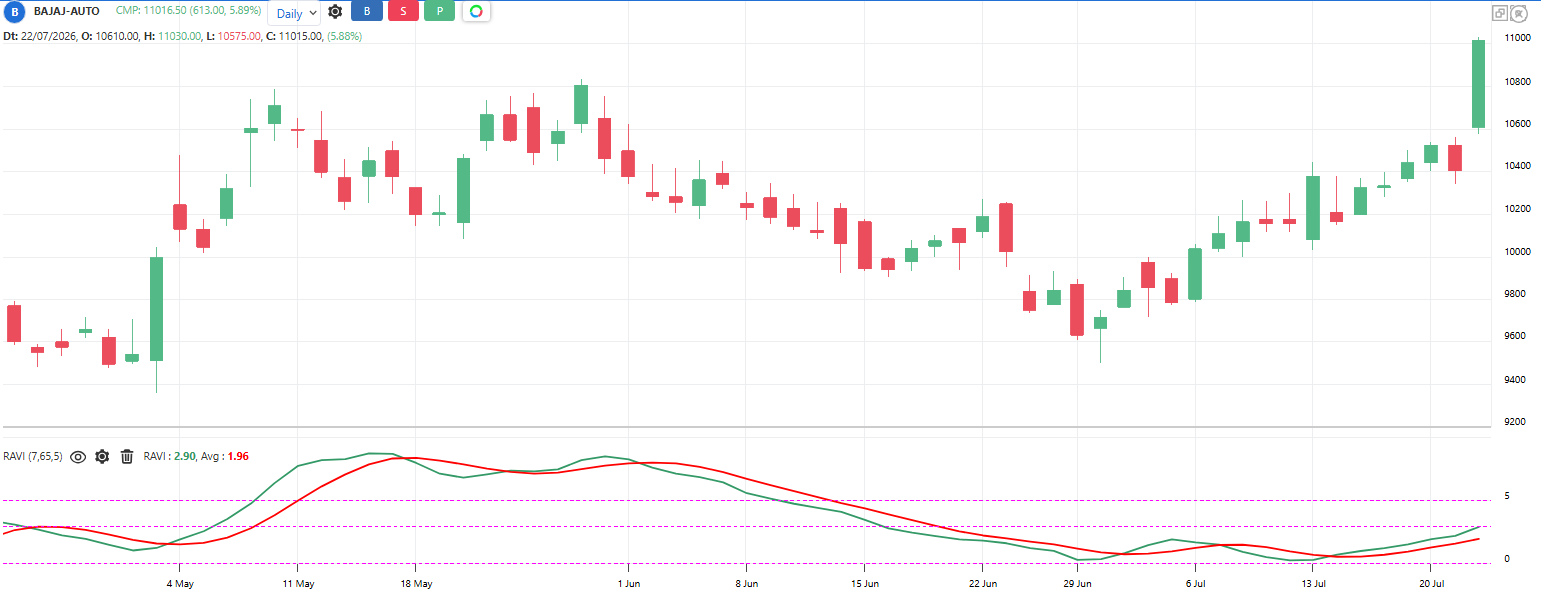
The Indicator answers one question: is the market trending or ranging? It measures the percentage gap between a fast and a slow moving average: |SMA 7 – SMA 65| / SMA 65 x 100. A big gap means the averages have separated, so a trend is on. A small gap means they are together, so the market is ranging.
Default period: 7, 65, 5
Rising RAVI indicates trend developing. Falling RAVI indicates trend fading into a range.
This indicator does not give direction. Use it to choose which type of signals to trust.
Useful readings:
RAVI above 3%: Market is trending, use trend-following tools
RAVI below 3%: Market is ranging, use oscillators and range tools
RAVI rising through 3%: Fresh trend starting, breakout signals become reliable
RAVI falling back under 3%: Trend over, book trend profits
RAVI very high and flattening: Mature trend, late to enter
Same job as the Choppiness Index, with a simpler calculation
Objective rules:
Trend mode: RAVI above 3%, allow trend-following signals (SuperTrend, Donchian, moving averages).
Range mode: RAVI below 3%, allow range signals (RSI, Stochastic, Bollinger reversals).
Fresh trend rule: RAVI crosses above 3% while rising, take the current breakout direction
Exit trend trades: RAVI drops back below 3% while holding a trend position
What makes it unique:
It defines trending with one measurable number – the percentage gap between two averages – and one threshold. The simplest regime detector that can be coded in one line.
The indicator table value in TradePoint & RZone also provides you with a list of all values of this indicator for any group of stocks. This will allow you to compare the readings of this indicator across different stocks.
This indicator is also available in the System Builder on RZone & TradePoint for all charting methods. Using the system builder, you can develop various strategies based on the different conditions already present in this indicator. Additionally, it can be used with other indicators or price patterns to develop effective trading strategies. For any group of stocks and market segments, you can scan and backtest stocks based on those strategies.
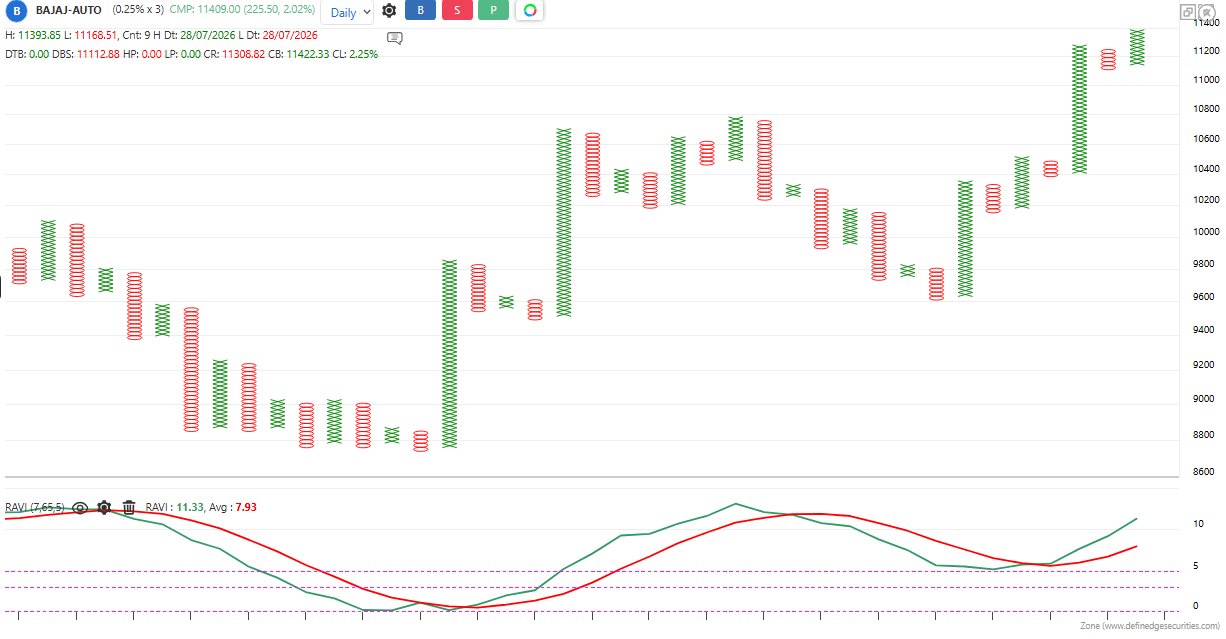
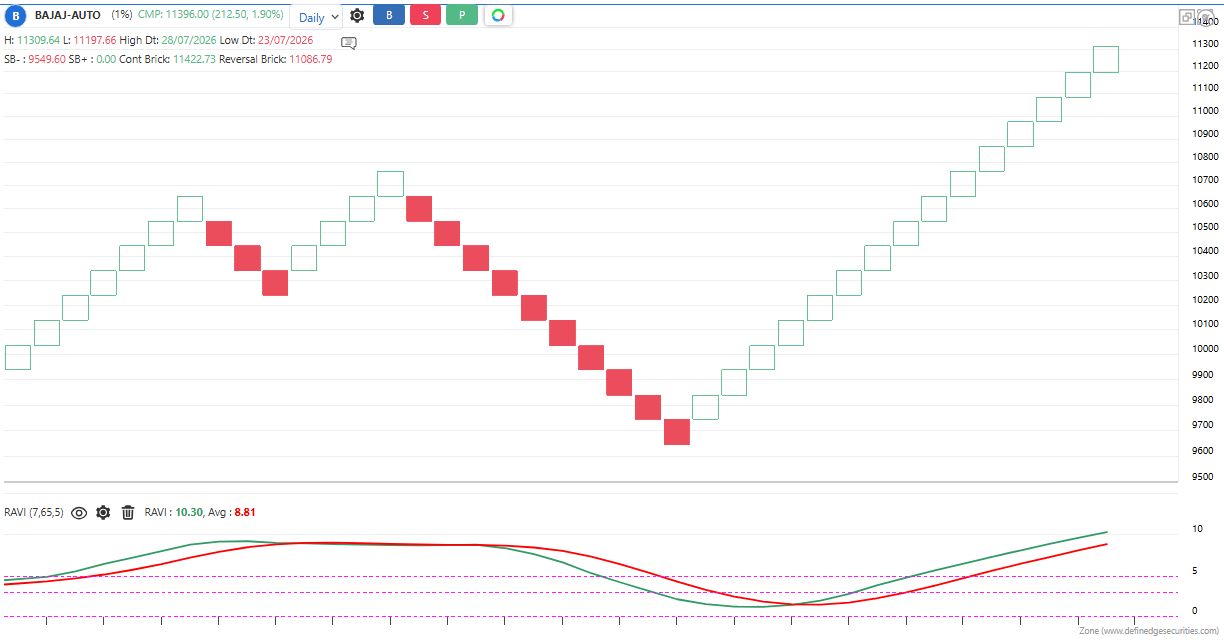
The indicator is applicable to all types of charting. It is calculated based on the number of columns on P&F charts, bricks on Renko charts, lines on Line-break charts, candles on Heikin-Ashi charts, and lines on Kagi charts. While the formula and reading of the indicators remain the same, they become more dynamic on these charts.