Customer Support : 020-61923200, [email protected] | Call and Trade : 020-61923220

Detrended Price Oscillator (DPO)
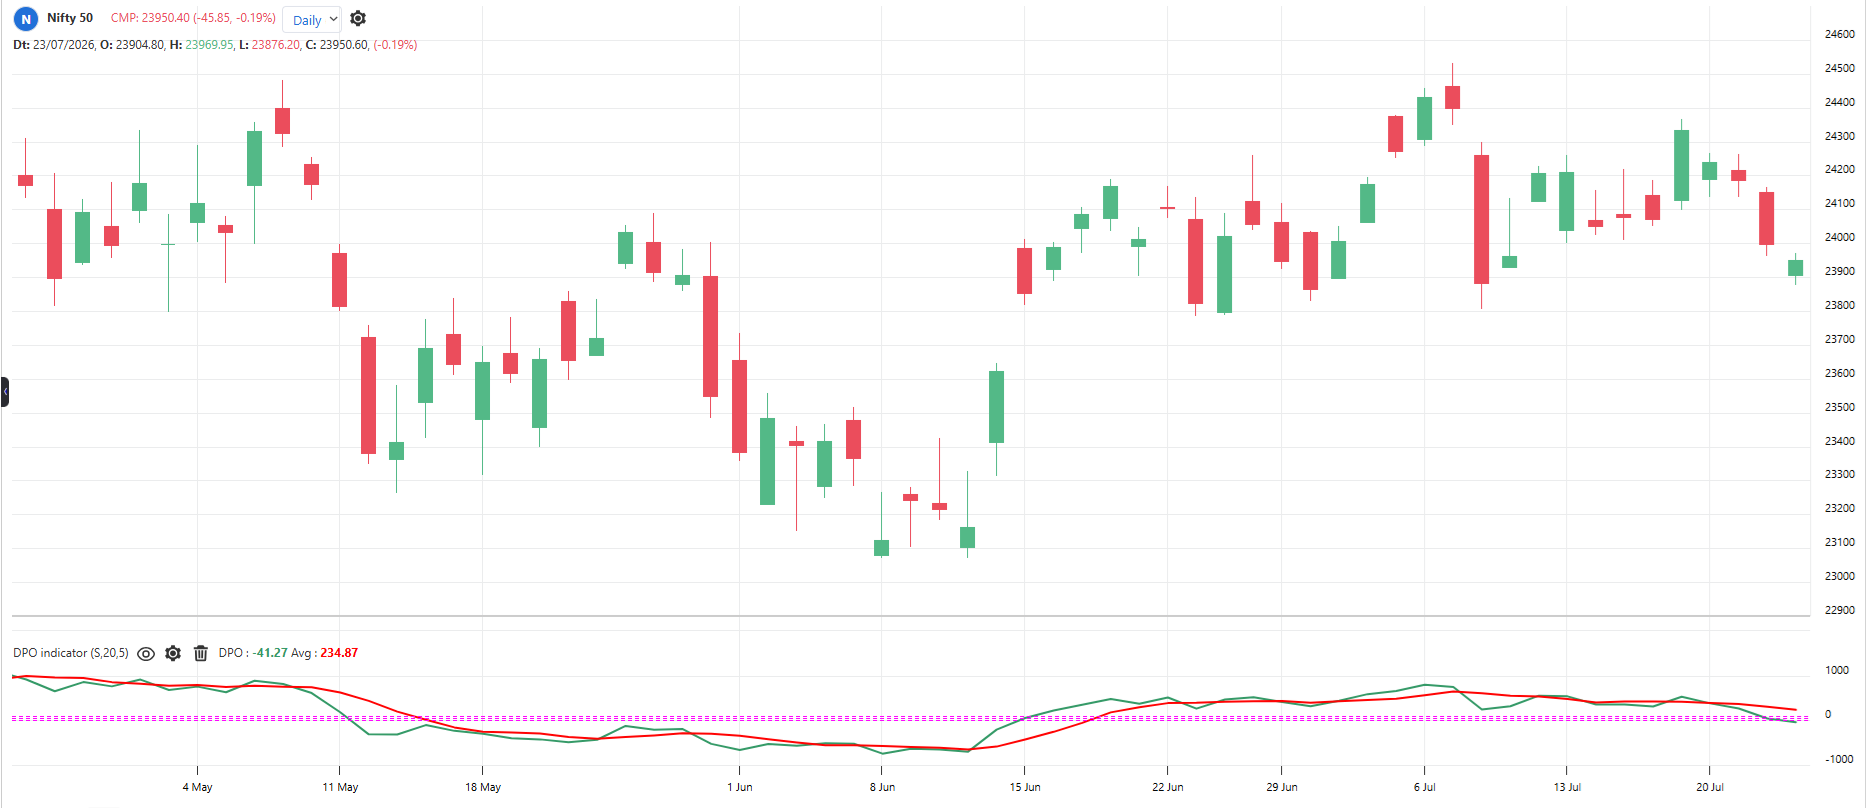
#cycle #oscillator
Inventor:
Removes the long-term trend from price so you can see the shorter cycles clearly. It compares price with a moving average shifted back in time, and plots the difference around zero. Its job is to show cycle tops and bottoms and measure how long a typical cycle lasts.
Default period: 20 (SMA shifted back by period/2 + 1 bars)
Line above zero indicates price is above its shifted average, cycle high side. Line below zero indicates cycle low side.
It is a cycle tool, not a trend tool. It says nothing about the bigger trend.
Useful readings:
Peaks above zero: Short-term cycle tops
Troughs below zero: Short-term cycle bottoms
Distance between two DPO troughs: Length of one full cycle, use it to time entries
DPO turning up from a trough: New cycle starting up
DPO turning down from a peak: Cycle rolling over
Works best in sideways or gently trending markets
Objective rules:
Bullish: DPO turns up from below zero.
Bearish: DPO turns down from above zero.
Cycle timing rule: Measure average bars between DPO troughs; look for buys near that count after the last trough
Trend filter: Take DPO buy signals only when price is above 200 SMA, sell signals only when below
What makes it unique:
It deliberately deletes the trend so only the cycles remain. Its main output is not a signal but a measurement: how long this market’s rhythm actually is.
The indicator table value in TradePoint & RZone also provides you with a list of all values of this indicator for any group of stocks. This will allow you to compare the readings of this indicator across different stocks.
This indicator is also available in the System Builder of RZone & TradePoint for all charting methods. Using the system builder, you can develop various strategies based on the different conditions already present in this indicator. Additionally, it can be used with other indicators or price patterns to develop effective trading strategies. For any group of stocks and market segments, you can scan and backtest stocks based on those strategies.
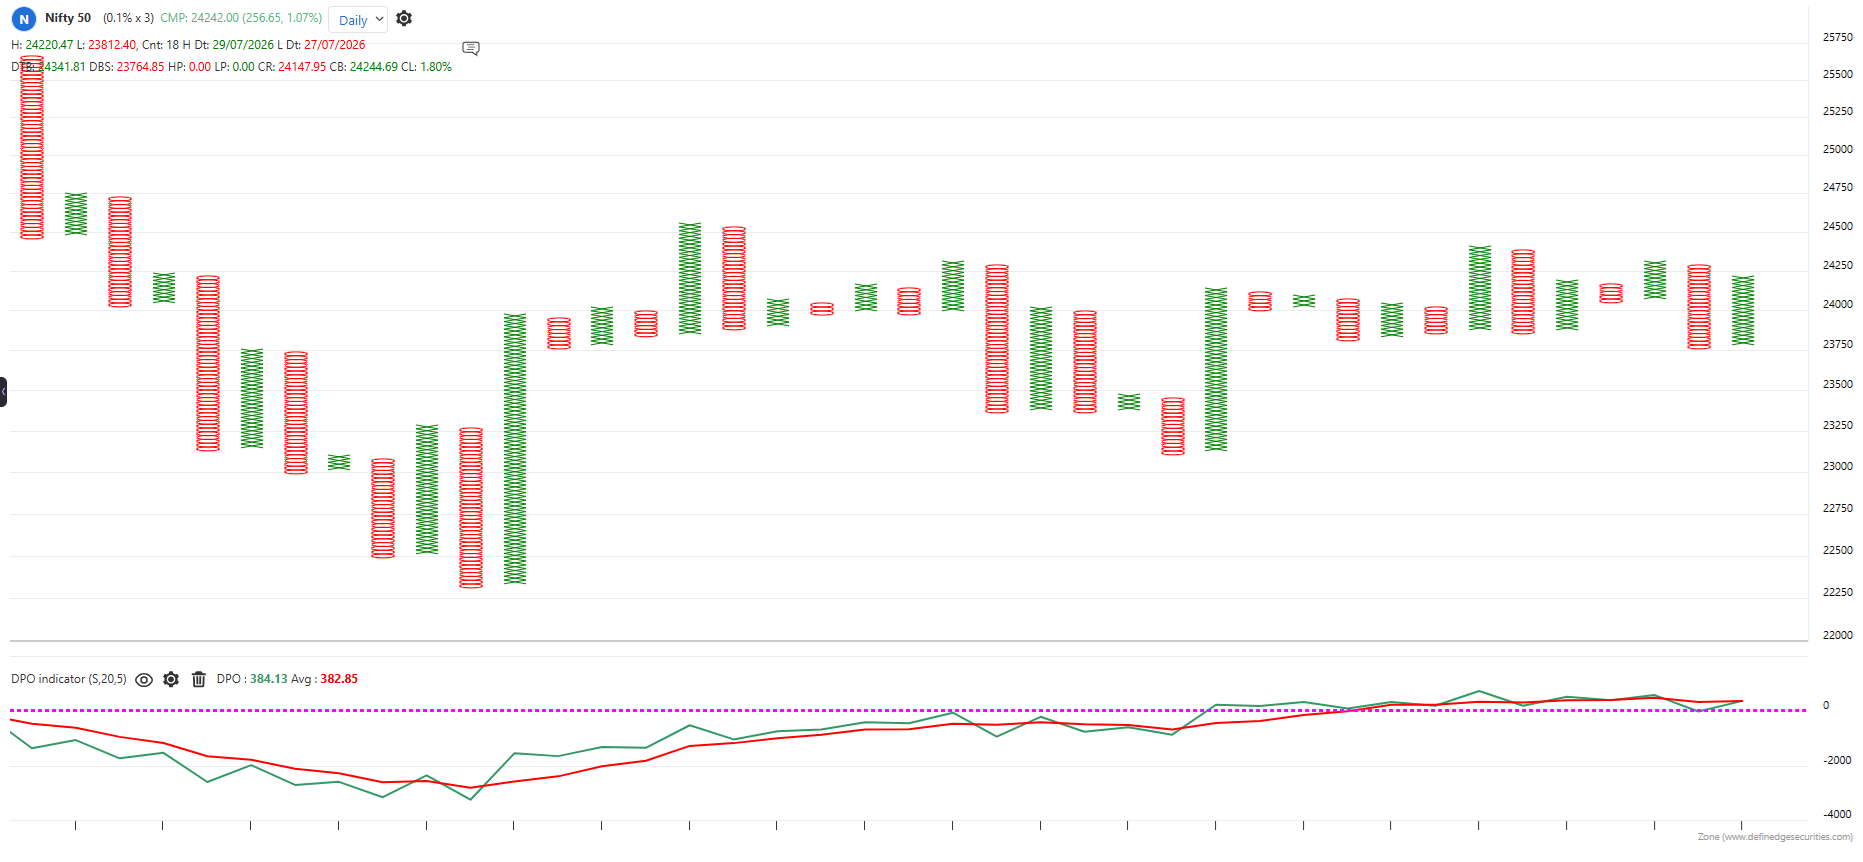
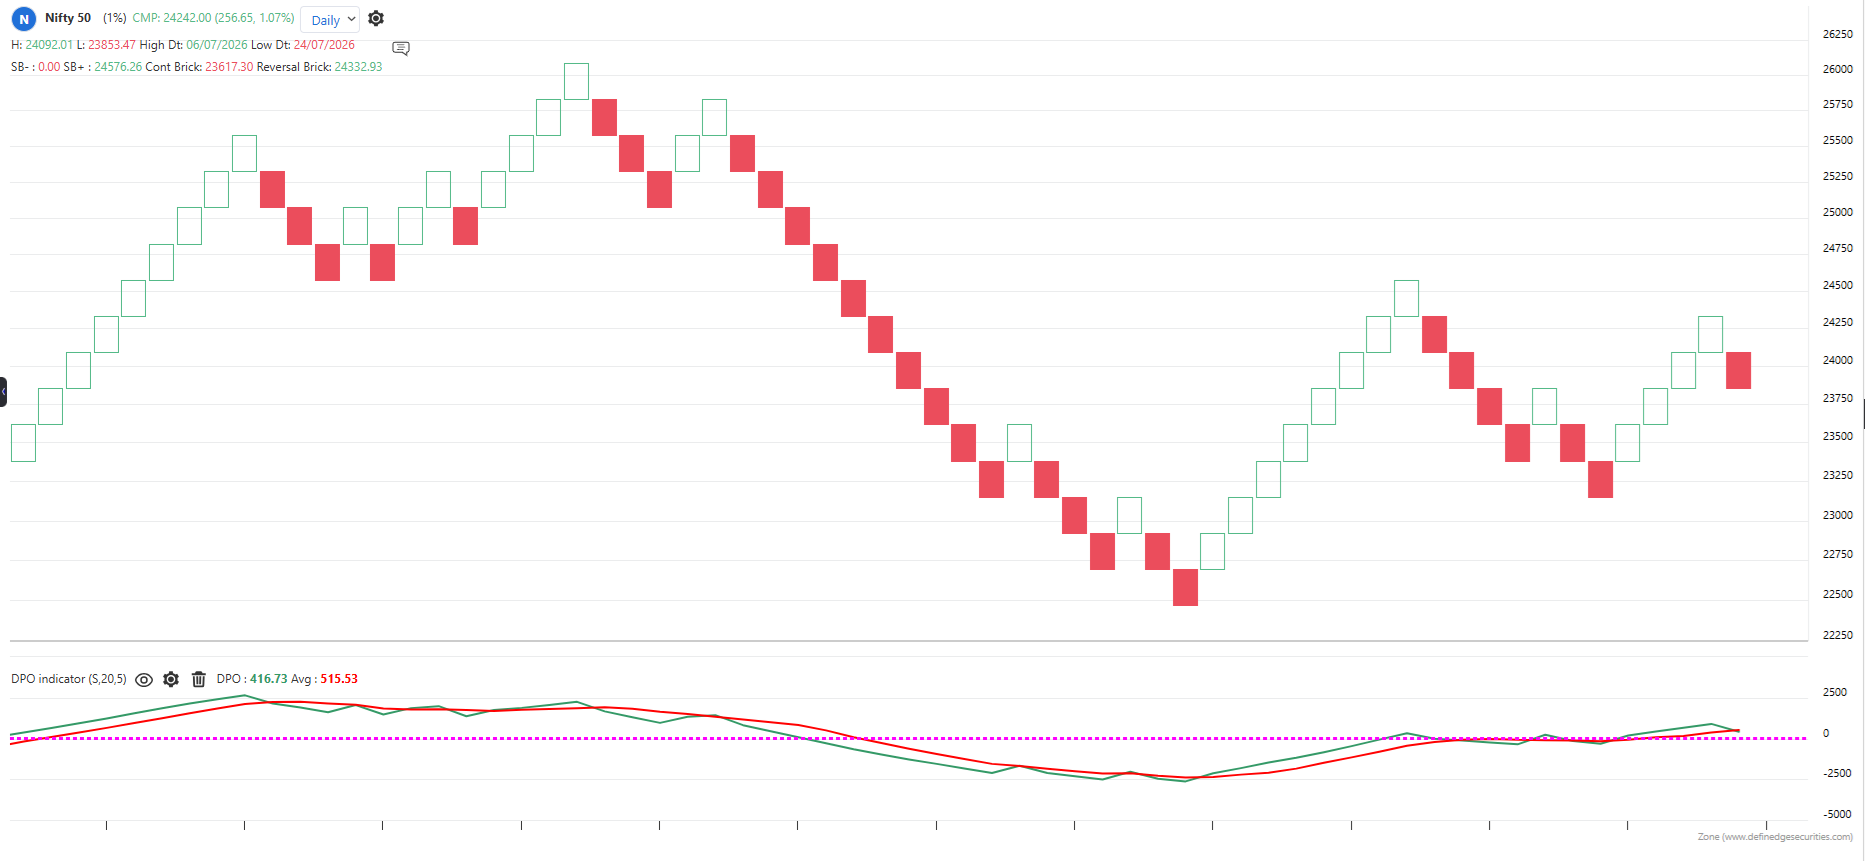
The indicator is applicable to all types of charting. Calculated based on the number of columns on P&F charts, bricks on Renko charts, lines on Line-break charts, candles on Heikin ashi charts, and lines on Kagi charts. While the formula and reading of the indicators remain the same, they become more dynamic on these charts.