Customer Support : 020-61923200, [email protected] | Call and Trade : 020-61923220

Performance Indicator
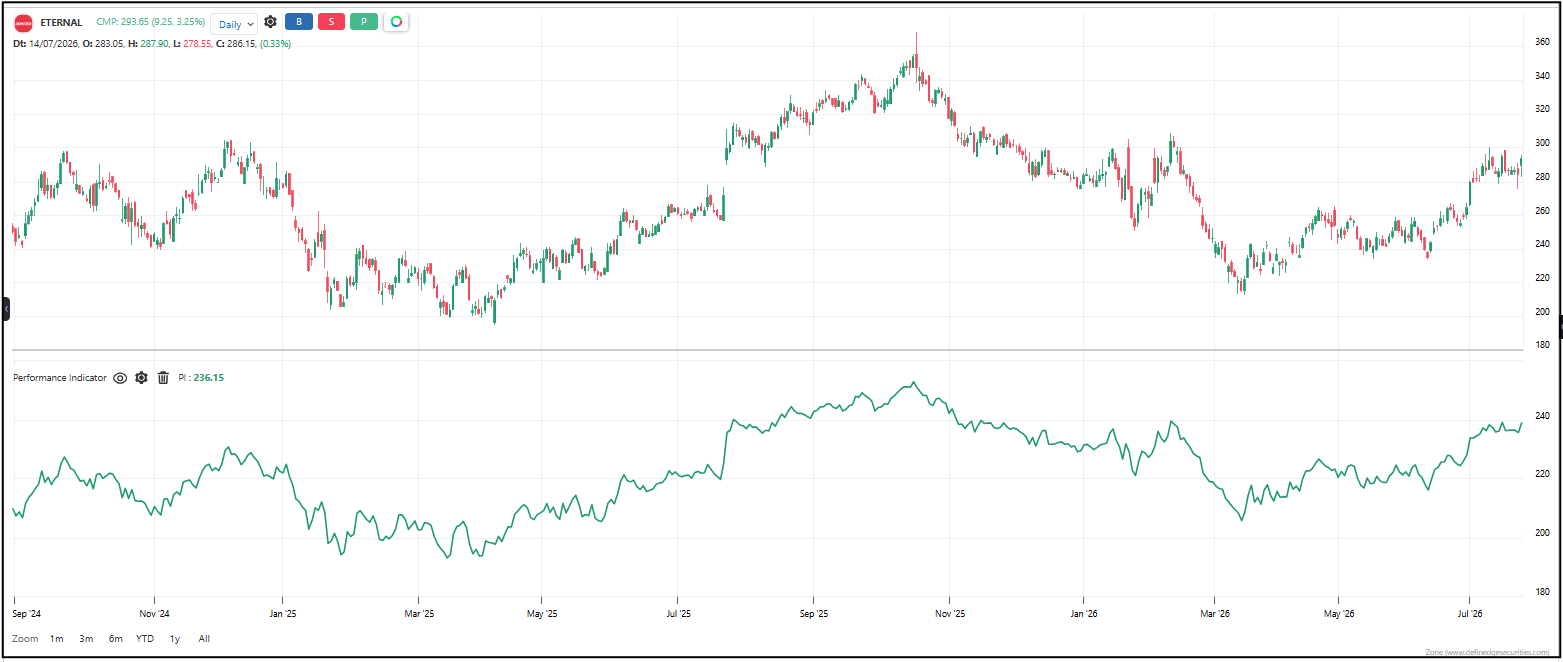
#returns #cumulative #performance #trend
Performance Indicator tracks the total cumulative return of an asset from a starting point. It adds up every day’s percentage gain or loss into a single running total. When the line rises, the asset is gaining value overall. When it falls, the asset is losing value overall. It’s a clean, uncluttered view of how much money you’d have made or lost from a fixed starting point.
Default period: None (runs continuously from start)
Line behavior: A single line that starts from a baseline and moves up or down based on daily price changes. Rising means cumulative gains are growing. Falling means cumulative losses are mounting. The slope shows the pace — steep rises mean strong performance, steep falls mean sharp drawdowns.
Useful readings:
– Line rising — the asset is in a cumulative gain phase. You’re up from the starting point.
– Line falling — the asset is in a cumulative loss phase. You’re down from the starting point.
– Steep upward slope — performance is accelerating. Strong momentum.
– Steep downward slope — performance is deteriorating fast. Sharp drawdown.
– Flattening after a rise — gains are slowing. Momentum is fading.
– Flattening after a fall — losses are slowing. The worst may be over.
– New highs — the asset has never performed better cumulatively.
– New lows — the asset has never performed worse cumulatively.
Objective rules:
– Go long when the performance line turns upward after a period of decline — the cumulative trend is reversing bullish.
– Go short when the performance line turns downward after a period of rise — the cumulative trend is reversing bearish.
– Exit long when the line stops rising and starts falling.
– Exit short when the line stops falling and starts rising.
– Compare two assets’ performance lines side by side — the steeper rising line is the stronger performer.
– Avoid trading when the line is flat — the asset is neither gaining nor losing meaningfully.
What makes it unique: Most charts show raw price, which can be misleading if you started at a different entry point. This indicator shows pure cumulative return from a baseline — so you always know exactly how much value has been created or destroyed since you started watching. It’s the simplest possible way to track performance over time.
The indicator table value in TradePoint & RZone also provides you with a list of all values of this indicator for any group of stocks. This will allow you to compare the readings of this indicator across different stocks.
This indicator is also available in the System Builder of RZone & TradePoint for all charting methods. Using the system builder, you can develop various strategies based on the different conditions already present in this indicator. Additionally, it can be used with other indicators or price patterns to develop effective trading strategies. For any group of stocks and market segments, you can scan and backtest stocks based on those strategies.
The indicator is applicable to all types of charting. Calculated based on the number of columns on P&F charts, bricks on Renko charts, lines on Line-break charts, candles on Heikin ashi charts, and lines on Kagi charts. While the formula and reading of the indicators remain the same, they become more dynamic on these charts.