Customer Support : 020-61923200, [email protected] | Call and Trade : 020-61923220

Quality Action Indicator
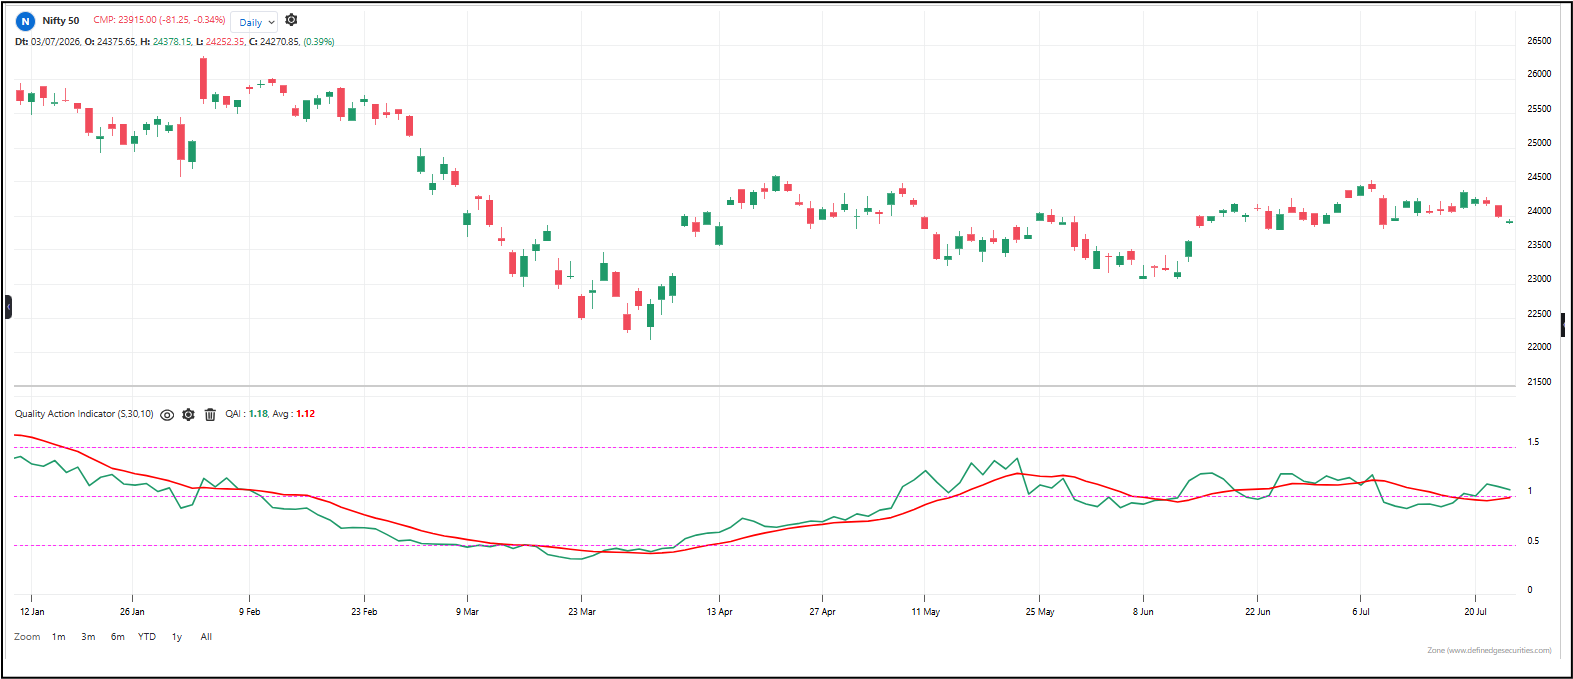
#trend #quality #strength #direction
QAI (Quality Action Indicator) measures whether up moves or down moves are stronger and more decisive. It doesn’t care about price direction — it cares about the quality of each day’s action. A market can be rising but with weak, fragile up days and sharp, violent down days. QAI exposes that hidden weakness.
Default period: 30
Line behavior: QAI moves above and below a center line at 1. Above 1 means up moves are bigger and better quality. Below 1 means down moves are bigger and more forceful. A smoothed average line runs with it to cut through noise.
Useful readings:
– QAI above 1 — bulls are in control with strong, decisive up moves.
– QAI below 1 — bears are in control with sharp, heavy down moves.
– QAI near 1 — both sides are evenly matched. The market is balanced or choppy.
– QAI above its average line — quality is strong and confirmed.
– QAI below its average line — quality is deteriorating.
– Extreme highs can signal overextended bullish quality; extreme lows can signal overextended bearish quality.
Objective rules:
– Go long when QAI crosses above 1 and stays above its average line.
– Go short when QAI crosses below 1 and stays below its average line.
– Exit when QAI crosses back through 1.
– Stay out when QAI hovers near 1 — the market has no directional quality.
What makes it unique: Most indicators only tell you where price is going. QAI tells you how strong each side’s moves are. It can warn you that a rising market is actually built on weak up days and heavy down days — long before price breaks down.
The indicator table value in TradePoint & RZone also provides you with a list of all values of this indicator for any group of stocks. This will allow you to compare the readings of this indicator across different stocks.
This indicator is also available in the System Builder of RZone & TradePoint for all charting methods. Using the system builder, you can develop various strategies based on the different conditions already present in this indicator. Additionally, it can be used with other indicators or price patterns to develop effective trading strategies. For any group of stocks and market segments, you can scan and backtest stocks based on those strategies.
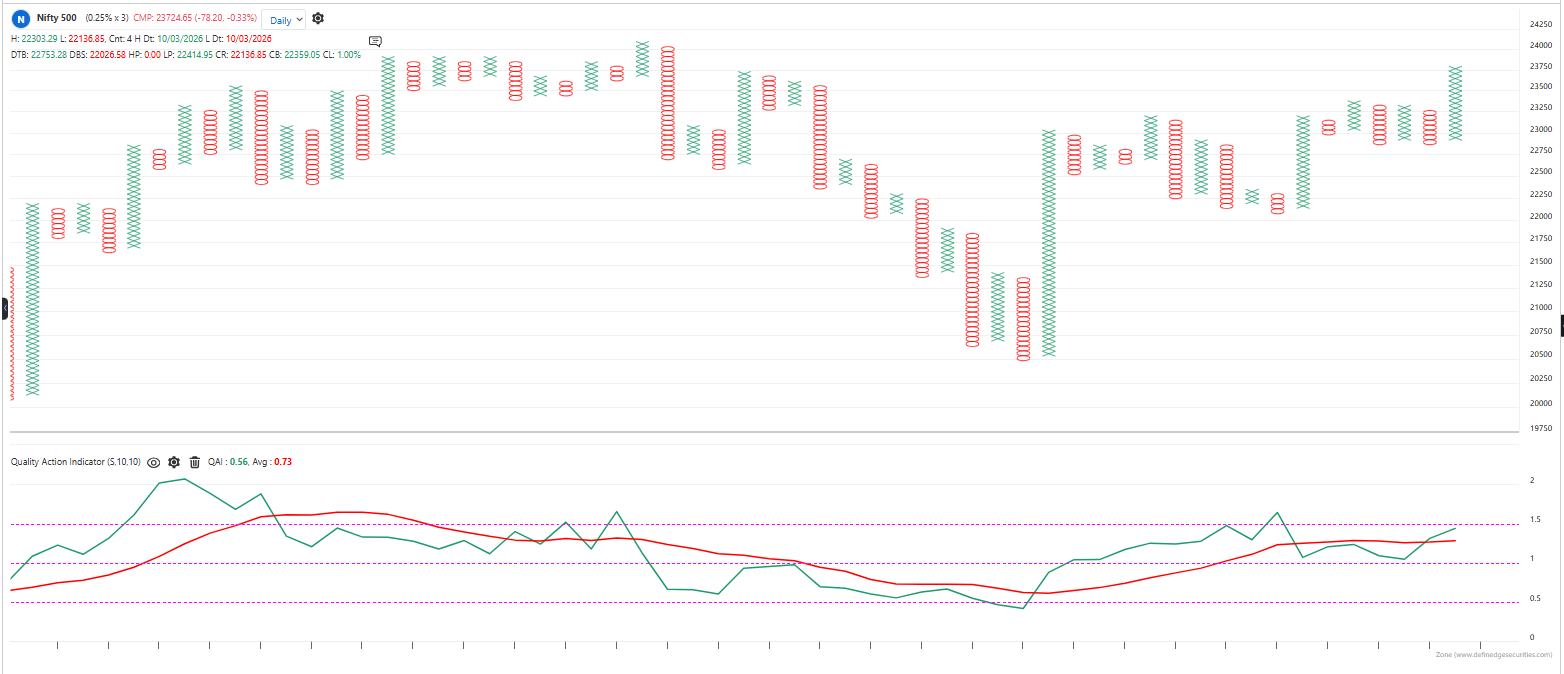
Default Period – 10
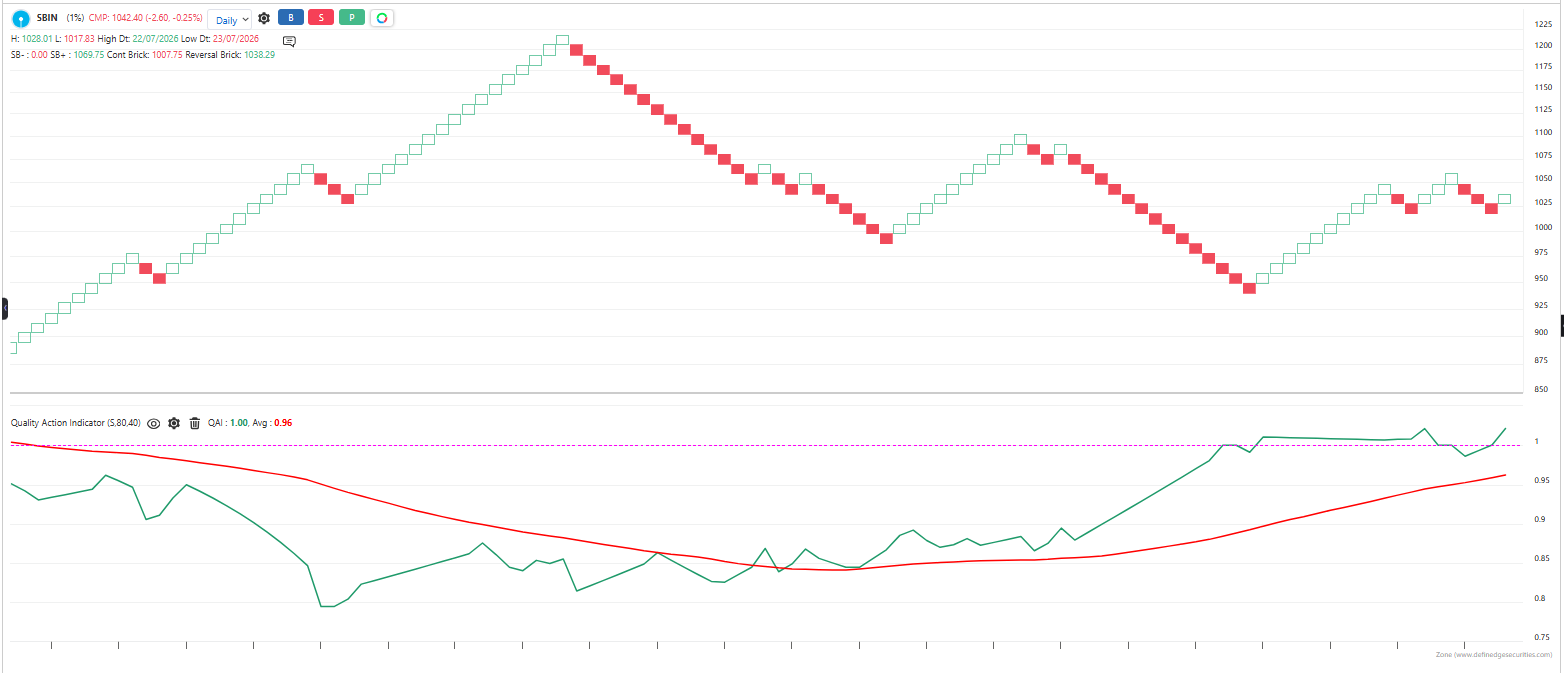
Default Period – 80
The indicator is applicable to all types of charting. Calculated based on the number of columns on P&F charts, bricks on Renko charts, lines on Line-break charts, candles on Heikin ashi charts, and lines on Kagi charts. While the formula and reading of the indicators remain the same, they become more dynamic on these charts.