Customer Support : 020-61923200, [email protected] | Call and Trade : 020-61923220

Discrete Moving Average
#trend #movingaverage #smoothing #lag-reduction
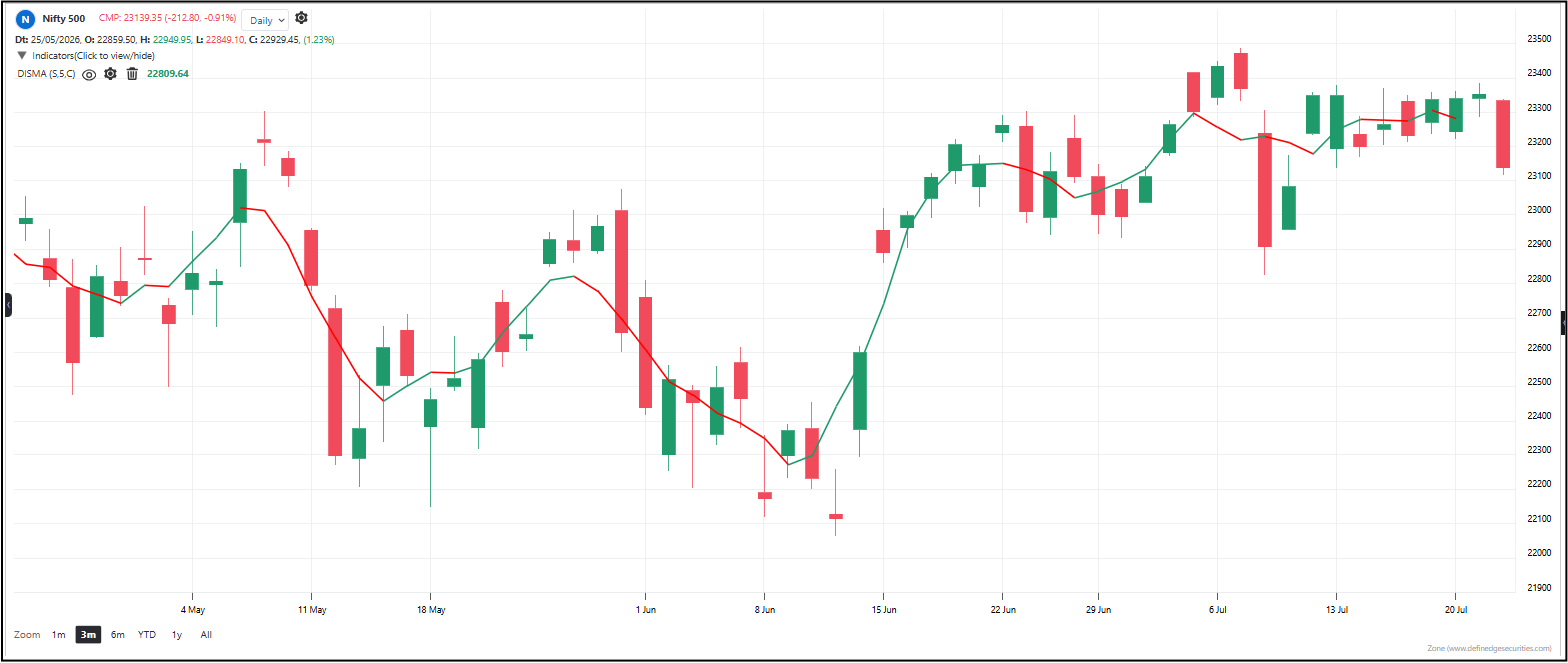
The Discrete Moving Average is a refined version of the standard moving average designed to reduce lag. Instead of averaging raw prices directly, it first calculates a short discrete average that captures recent price structure more cleanly, then applies a second smoothing layer on top. The result is a trend line that follows price more closely than a traditional SMA or EMA while still filtering out market noise.
Default period: 20 (smoothing MA), 5 (discrete window)
Line behavior:
Moves smoothly with price trend. It sits above price in downtrends and below price in uptrends, acting as dynamic support or resistance. The discrete pre-processing step helps it react faster to trend changes compared to a plain moving average of the same period.
Useful readings:
– Price above DEMA: Uptrend is in control
– Price below DEMA: Downtrend is in control
– Slope pointing up: Bullish momentum
– Slope pointing down: Bearish momentum
– Price crossing above: Potential trend reversal to the upside
– Price crossing below: Potential trend reversal to the downside
Objective rules:
– Buy when price crosses above the Discrete Moving Average
– Sell when price crosses below the Discrete Moving Average
– Use the slope of the line to confirm trend direction
– In strong trends, pullbacks to the DEMA often act as support (uptrend) or resistance (downtrend)
– Combine with a momentum oscillator to filter false crossover signals in sideways markets
The indicator table value in TradePoint & RZone also provides you with a list of all values of this indicator for any group of stocks. This will allow you to compare the readings of this indicator across different stocks.
This indicator is also available in the System Builder on RZone & TradePoint for all charting methods. Using the system builder, you can develop various strategies based on the different conditions already present in this indicator. Additionally, it can be used with other indicators or price patterns to develop effective trading strategies. For any group of stocks and market segments, you can scan and backtest stocks based on those strategies.
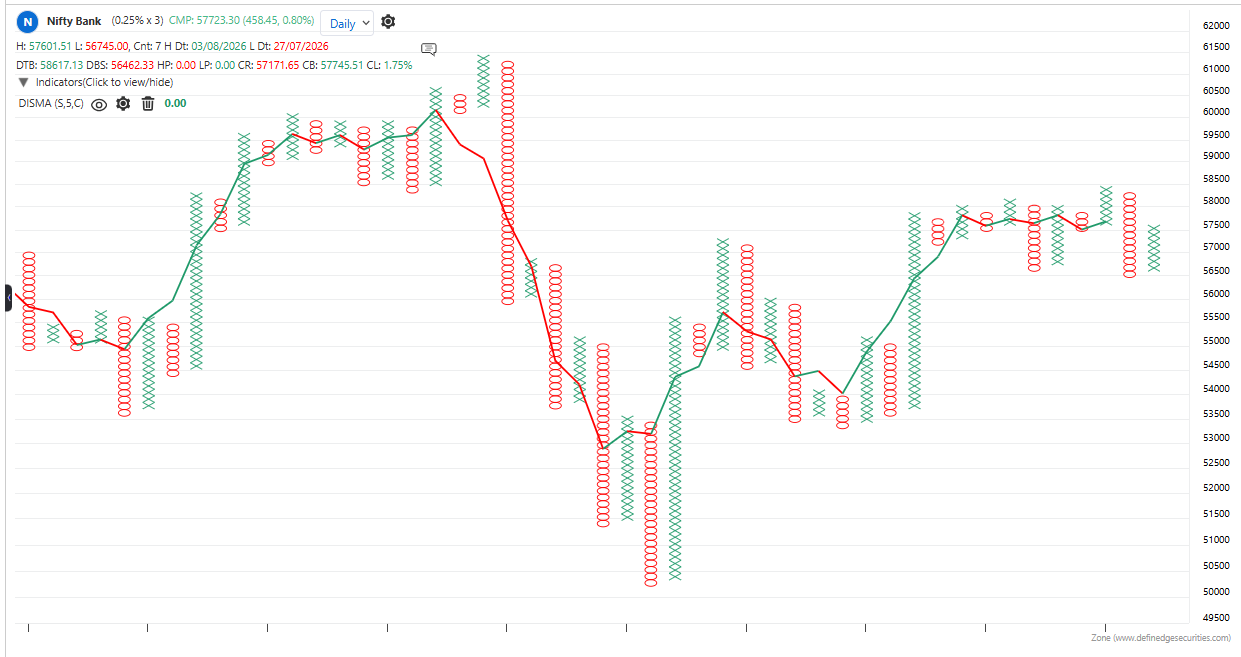
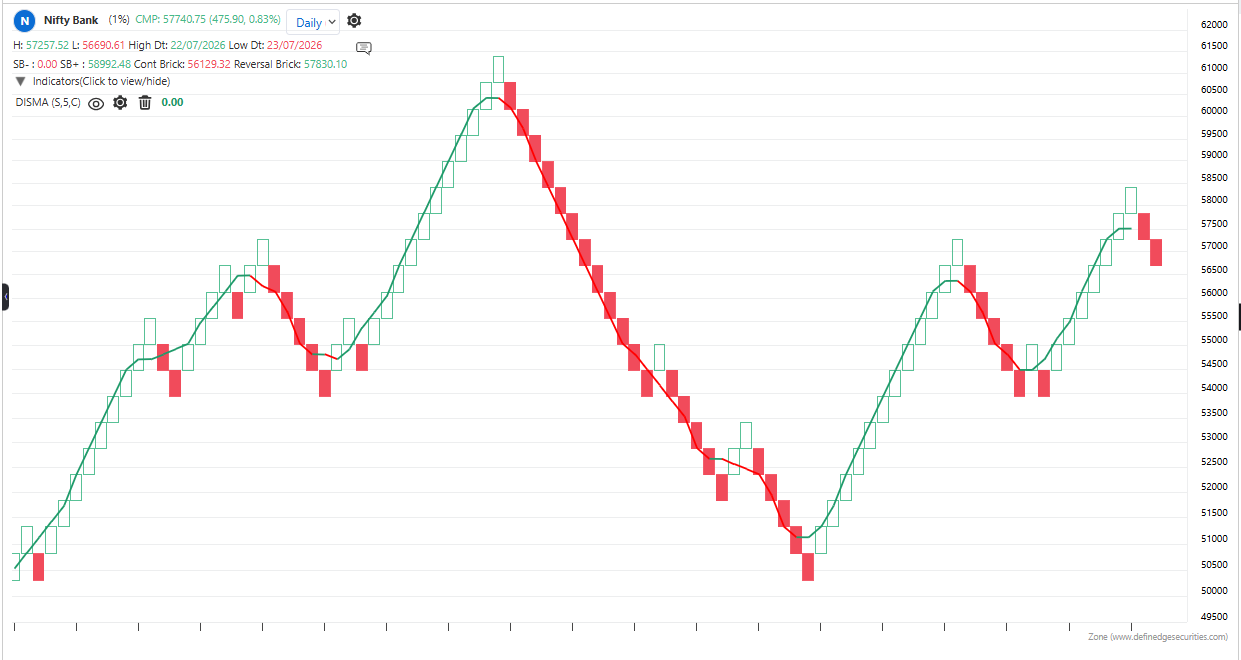
The indicator is applicable to all types of charting. It is calculated based on the number of columns on P&F charts, bricks on Renko charts, lines on Line-break charts, candles on Heikin-Ashi charts, and lines on Kagi charts. While the formula and reading of the indicators remain the same, they become more dynamic on these charts.