Indicators

Accumulation And Distribution Line
Adaptive Moving Average
Adaptive RSI Indicator
Adaptive TSI
ADX (Average Directional Index) Indicator
Alligator Indicator
AMMA Indicator
Aroon Indicator
Aroon Oscillator
ATR Based SMA
ATR Deviation Ranking
ATR Percentile Indicator
ATR Rank Indicator
ATR Stop-loss Indicator
ATR% (Average True Range)
Average Column Length
Average Daily Range (ADR)
Average Return
Average Trend
Average True Range [ATR]
Awesome Oscillator
Balance of Power
BCI Indicator
Bollinger Band
Bollinger Band Size
Bollinger Bandwidth
Bollinger BTV Indicator
Brick Count Indicator
Brick Indicator
Brick Zone
Bull Bear Session counter
CAGR
Camarilla
Candlestick Momentum Index [CMI]
Candlestick Momentum Index with TSI [CMIT]
CCI (Commodity Channel Index)
Center Of Gravity
Chaikin Volatility
Chande Kroll Stop Indicator
Chikou Span
Choppiness Index
CMB Composite index
CMO
Column Length
Connors RSI
Coppock Indicator
Count-Moving Average Indicator
CRSI
D Cap-Shoe RS Indicator
D Disparity Dots – D Smart
D Disparity Dots – Super trend
D Momentum Pullback
D Momentum Pullback Indicator
D Smart Line
D-Disparity Dots Indicator
DCA Volatility Squeeze
Detrended Price Oscillator (DPO)
Discrete Moving Average
Disparity Index Indicator
DMA Histogram
Donchian Bandwidth
Donchian Channel
Double Exponential Moving Average (DEMA) Indicator
Double Moving Average
Double VWAP (Moving VWAP Crossover)
DTDB Indicator
Ease of Movement
Efficiency
Efficiency Ratio
Elder Impulse System
Elder Ray Index
Force Index
Forward Displaced Moving Average
Fresh vs Running
Gain Loss Count Indicator
GAPO Indicator
Guppy Multiple Moving Average
High Low Indicator
High Low Momentum Index
High Low Retracement
Hull Moving Average
Ichimoku Indicator
Intra VWAP
Intra VWAP Disparity Index
Intra VWAP Histogram
Intraday Momentum Index [IMI]
Keltner ATR
Keltner Channel
King Oscillator
KST - Know Sure Thing Indicator
MA Envelope
MA Score Indicator
MACD
MACD Histogram
MACD_V
MACD% Indicator
MACI (MA Convergence)
Mansfield Relative Strength
Mansfield RS Indicator
Mass Index
MAST Indicator
Money Flow Index [MFI]
Moving Average Channel
MP RSI Indicator
Multiple ROC%
Negative Volume Index (NVI)
No of days in P&F chart
Noise Rate Indicator
OIWAP (Open Interest Weighted Average Price)
On Balance Volume [OBV] Indicator
Parabolic SAR (PSAR)
Percent Away From MA
Percent B Indicator
Percentage Price Oscillator (PPO)
Percentage Volume Oscillator (PVO)
Performance Indicator
PIVOT Indicator
PMOX Indicator
Price by time
Price Median
Price Momentum Oscillator (PMO)
Price Rekha Indicator
Price Strength Index
QQE
Quality Action Indicator
Range Marker
Rank Index
Ratio Chart
Ratio Rank Indicator
Ratio RSI Indicator
RAVI
RDX
Relative Strength - Alpha Vol
Relative Strength – Alpha
Relative Strength Index (RSI)
Relative Volume (RVOL)
Return-Range Indicator (RRI)
RMI
ROC ABS
ROC%
Rohit’s Long Momentum Indicator
Rohit’s Momentum Indicator
Rohit’s Short Momentum Indicator
Rotation Factor
RS-NV
RS-TVR
RSI Cumulative Indicator
RSI Histogram
RSI Streak Indicator
RSI-sum indicator
Safe Zone
Senkou Span B
Shadow Rate Indicator (SRI)
Shadow%
Single Moving Average
Single VWAP
Smoothed Relative Strength Index
Smoother MA
Special K
Standard Deviation [SD]
Stochastic RSI
Stochastics Indicator
Stretch
Super Swing Line
Super Trend Indicator
Swing Line Indicator
Swing Price Volume Indicator
TMA Trend
Triple Brick Indicator
Triple Exponential Moving Average (TEMA) Indicator 
Triple Moving Average Indicator
Triple VWAP Indicator
Triple XO Indicator
TRIX Indicator
TS100 Indicator
TSI Indicator
TTM Squeeze
Turtle Bands - Bearish
Turtle Bands - Bullish
Typical Price – Average
Ulcer Index
Ultimate Oscillator
US-LS
Volar
Volatility
Volume
Volume Double Moving Average
Volume Rate of Change%
Vortex Indicator
VWAP ATR Bands
VWAP Bollinger Bands
Weightage close
Weighted ROC
WilliamPro_Go
WilliamR
X Ratio
XO AMA
XO Count
XO Indicator
XO Line
XO Strength
XO Volatility
XO Zone
XO Zone with Average
Z Score

Range Marker

#range #support-resistance #projection #swing #dynamic 

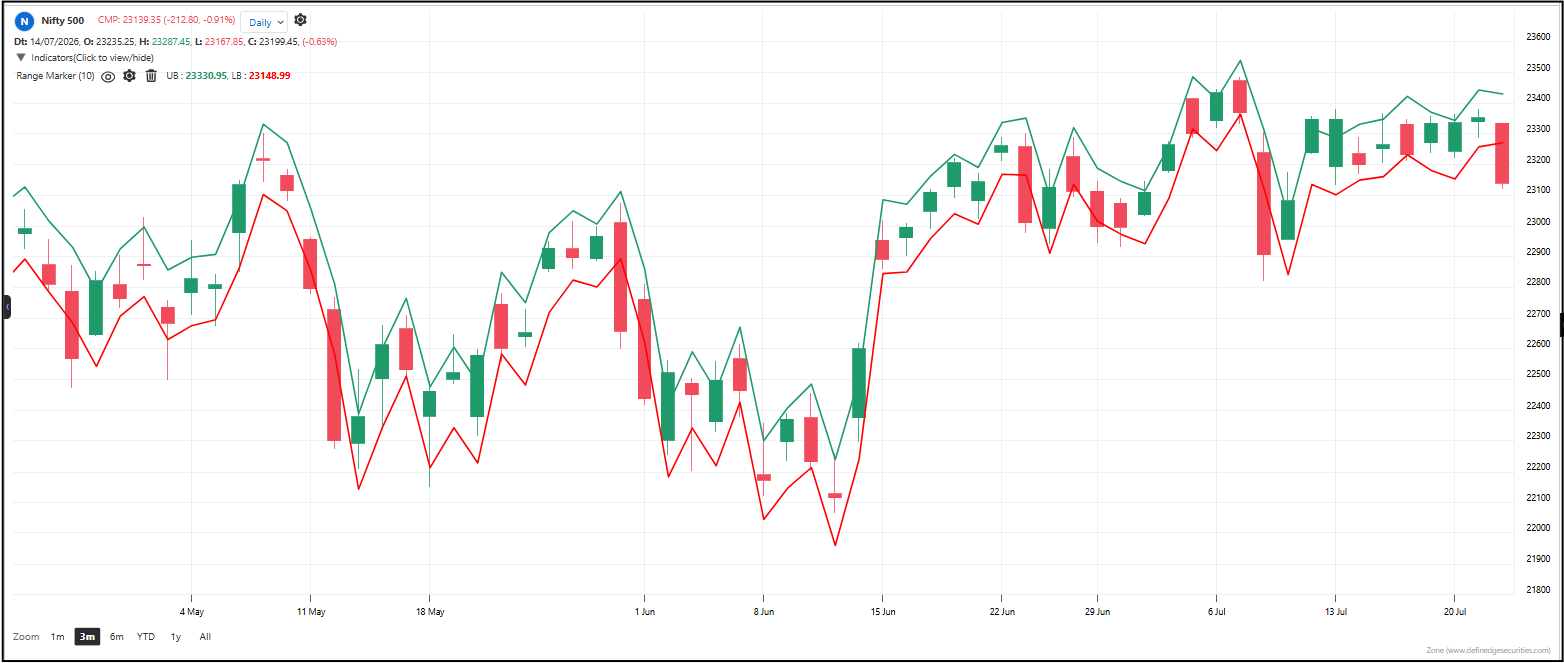
The Range Marker projects dynamic high and low boundaries around current price based on recent candle structure. It measures how far price typically extends above and below the closing price over a short window, then uses those average distances to draw projected upper and lower markers. Think of it as drawing a flexible channel that adapts to recent price behavior instead of using fixed percentages or volatility bands. 

Default period: 10 

Line behavior: 

Produces two projected lines: an upper marker and a lower marker. The upper marker sits above price and represents where highs tend to form based on recent candle patterns. The lower marker sits below price and represents where lows tend to form. Both lines move with price and adjust as recent candle structure changes. 

Useful readings: 

– Price near upper marker: Price is at the expected high of its normal range — potential resistance zone 

– Price near lower marker: Price is at the expected low of its normal range — potential support zone 

– Price breaking above upper marker: Unusually strong bullish move beyond normal range 

– Price breaking below lower marker: Unusually strong bearish move beyond normal range 

– Wide marker spread: Recent candles had large upper and lower wicks — higher intraday volatility 

– Narrow marker spread: Recent candles were tight — lower intraday volatility, possible consolidation 

Objective rules: 

– Consider selling or taking profits when price reaches the upper marker 

– Consider buying or adding positions when price reaches the lower marker 

– A break above the upper marker with follow-through confirms strong bullish momentum 

– A break below the lower marker with follow-through confirms strong bearish momentum 

– In a trending market, expect price to repeatedly test and break the markers in the direction of the trend 

– In a ranging market, the markers act as dynamic support and resistance levels 

What makes it unique: 

Unlike fixed Bollinger Bands or ATR channels, the Range Marker is built purely from the relationship between close, high, and low. It reflects actual candle shape rather than statistical deviation, making it especially useful for traders who watch intraday price action and want projected levels that match recent candle behavior. 

The indicator table value in TradePoint & RZone also provides you with a list of all values of this indicator for any group of stocks. This will allow you to compare the readings of this indicator across different stocks.

The indicator is applicable to all types of charting. Calculated based on the number of columns on P&F charts, bricks on Renko charts, lines on Line-break charts, candles on Heikin ashi charts, and lines on Kagi charts. While the formula and reading of the indicators remain the same, they become more dynamic on these charts.

This indicator is also available in the System Builder of RZone & TradePoint for all charting methods. Using the system builder, you can develop various strategies based on the different conditions already present in this indicator. Additionally, it can be used with other indicators or price patterns to develop effective trading strategies. For any group of stocks and market segments, you can scan and backtest stocks based on those strategies.


Open Demat Account