Customer Support : 020-61923200, [email protected] | Call and Trade : 020-61923220

DCA Volatility Squeeze
#volatility #squeeze #donchian #atr
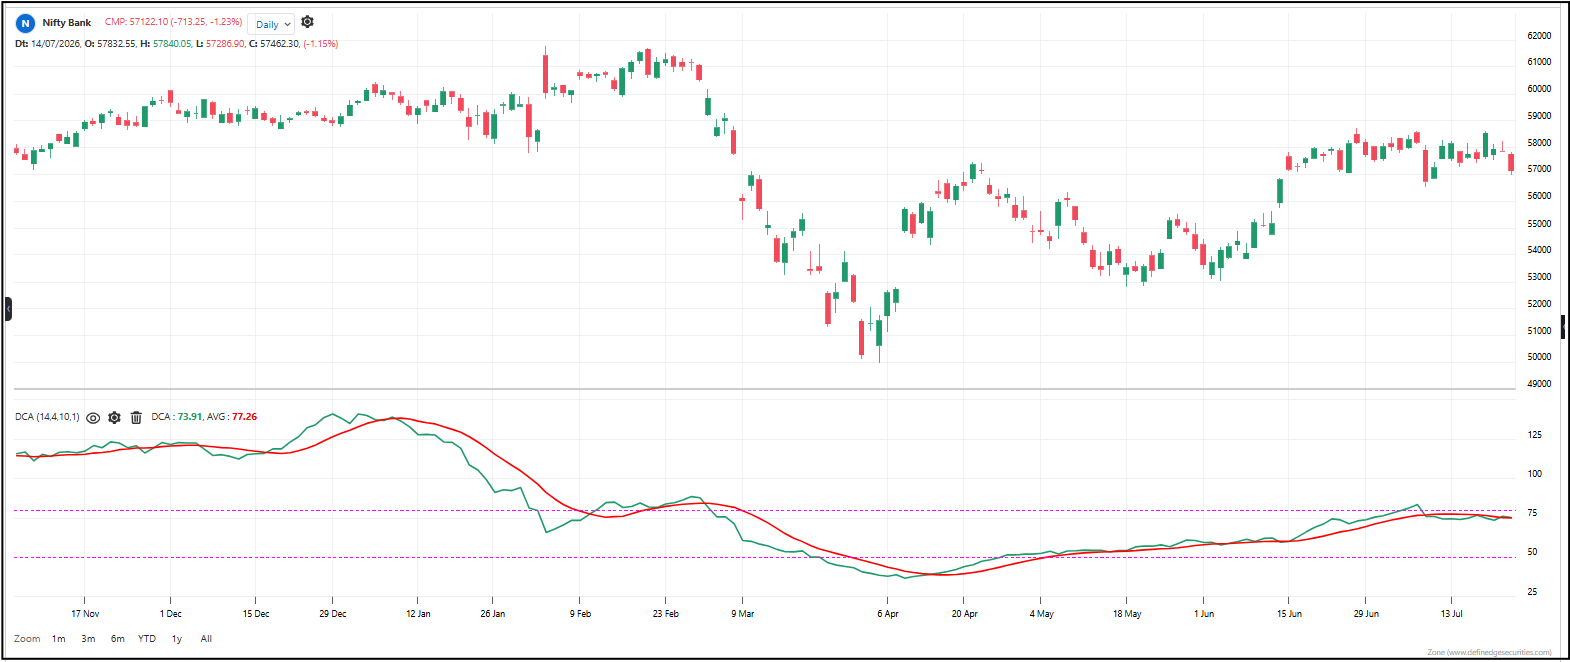
This indicator measures current volatility against a baseline average, helping you spot when the market is compressing before a big move. It compares the day-to-day price range to the average true range, then smooths the result into a single line. A Donchian band provides context for the overall price range. When volatility drops below normal, it’s a warning that a breakout is building.
Default period: 14 days (ATR baseline), 10 days (average line)
Line behavior: Oscillates around an average line. Low readings mean volatility is compressed; high readings mean volatility is expanded.
Useful readings: When the line drops to very low levels, the market is in a squeeze and a big move is likely coming. When it spikes, volatility is already being released. The average line helps you distinguish normal from extreme readings.
Objective rules:
– DCA below average line = volatility squeeze, prepare for breakout
– DCA above average line = volatility expansion, the move is in progress
– DCA at extreme lows = maximum compression, high-probability breakout zone
– DCA crossing above average = the squeeze is releasing
The indicator table value in TradePoint & RZone also provides you with a list of all values of this indicator for any group of stocks. This will allow you to compare the readings of this indicator across different stocks.
This indicator is also available in the System Builder on RZone & TradePoint for all charting methods. Using the system builder, you can develop various strategies based on the different conditions already present in this indicator.
Additionally, it can be used with other indicators or price patterns to develop effective trading strategies. For any group of stocks and market segments, you can scan and backtest stocks based on those strategies.
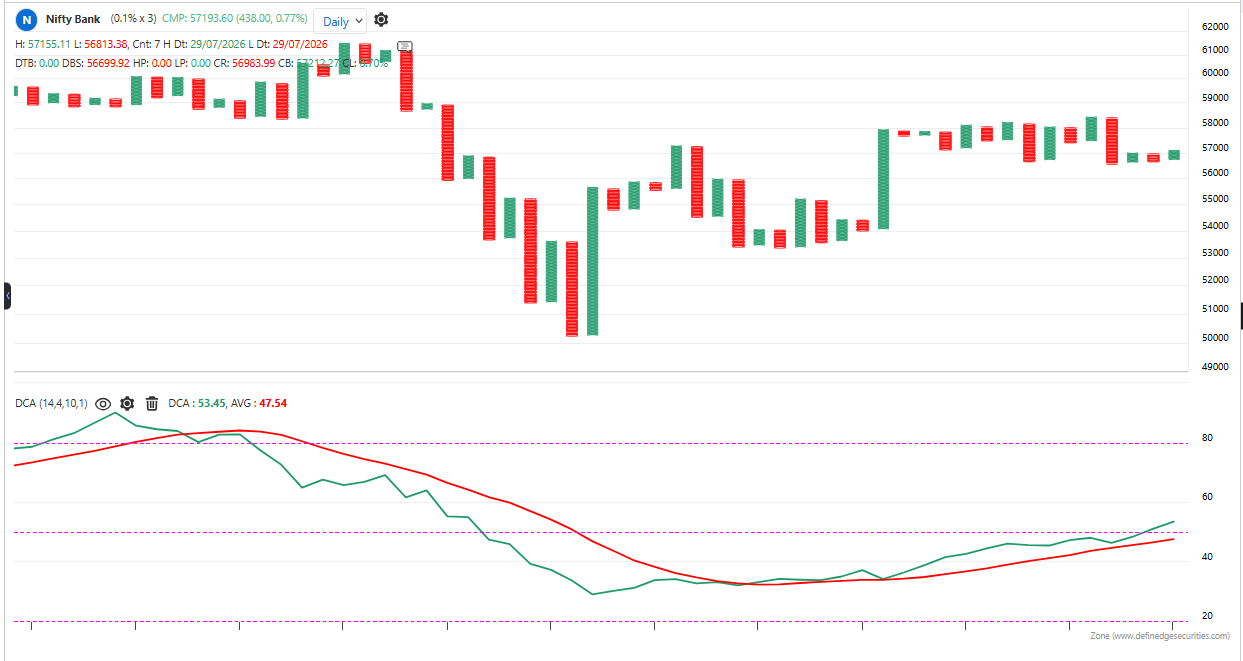
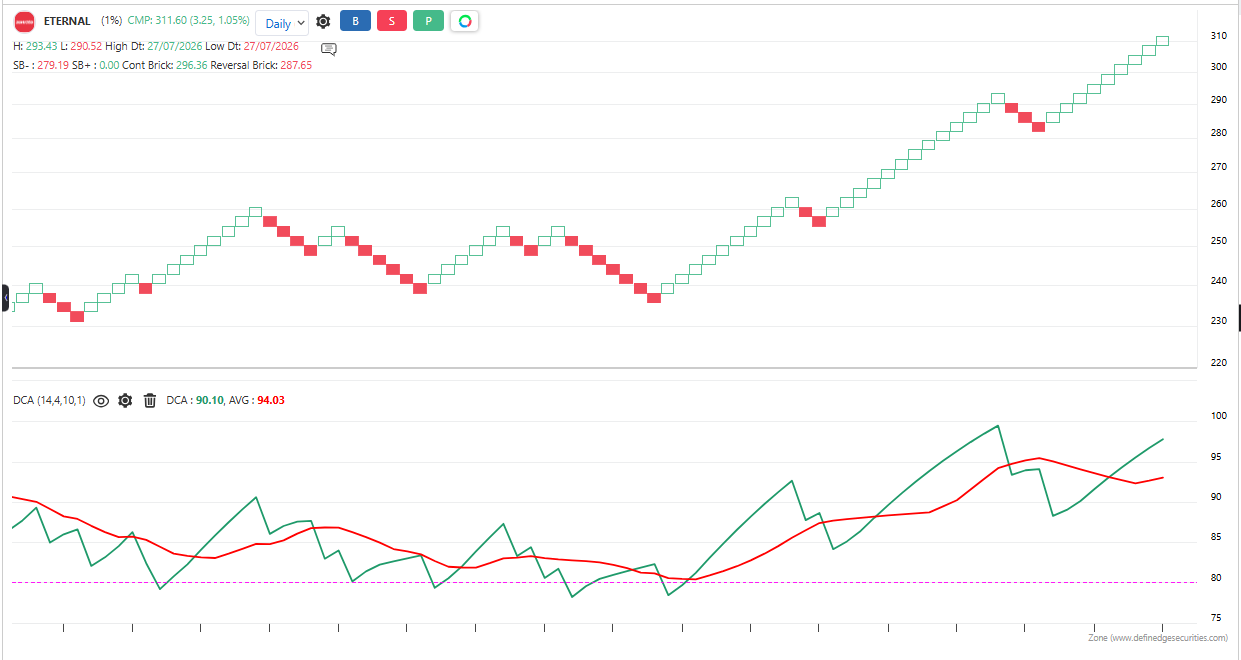
The indicator is applicable to all types of charting. It is calculated based on the number of columns on P&F charts, bricks on Renko charts, lines on Line-break charts, candles on Heikin-Ashi charts, and lines on Kagi charts. While the formula and reading of the indicators remain the same, they become more dynamic on these charts.