Customer Support : 020-61923200, [email protected] | Call and Trade : 020-61923220

Percentage Volume Oscillator (PVO)
#volume #momentum #oscillator #trend-confirmation
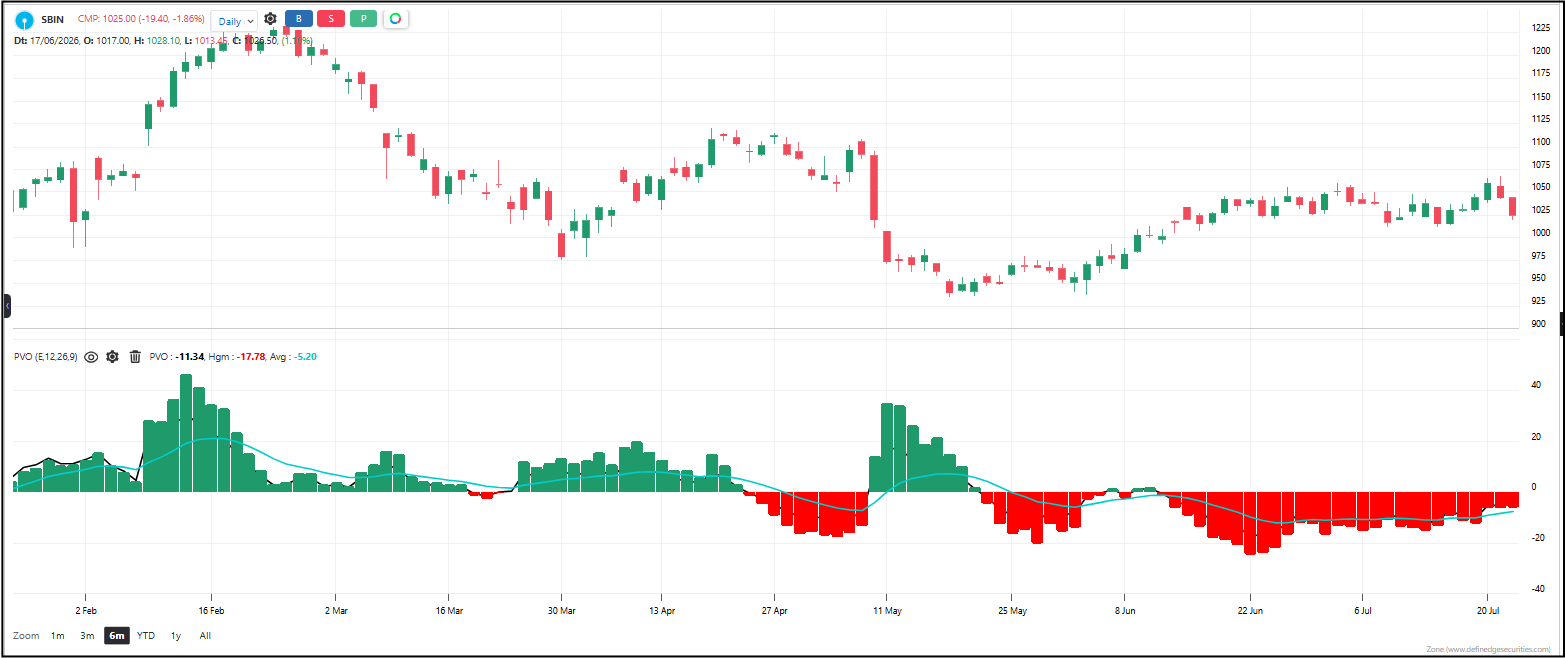
PVO (Percentage Volume Oscillator) tells you whether volume is supporting the current price move or drying up. It works like MACD, but for volume instead of price. When volume is growing, PVO rises. When volume is fading, PVO falls.
Default period: 12, 26, 9
Line behavior: The PVO line moves above and below zero. A signal line follows it smoothly. A histogram shows the gap between the two.
Useful readings:
– PVO above zero — volume is expanding. The current price move has real participation.
– PVO below zero — volume is shrinking. The current price move lacks conviction.
– PVO crosses above signal — volume momentum is shifting bullish.
– PVO crosses below signal — volume momentum is shifting bearish.
– Price makes a new high but PVO does not — volume is not confirming. The move is weak and likely to reverse.
Objective rules:
– Enter long when PVO crosses above the signal line and is above zero.
– Enter short when PVO crosses below the signal line and is below zero.
– Exit when the crossover reverses.
– Skip any trade where price and PVO move in opposite directions — volume does not confirm.
What makes it unique: Raw volume bars are noisy and hard to read. PVO turns volume into a clean, tradable oscillator with clear signals — so volume confirmation becomes as easy to act on as any price indicator.
The indicator table value in TradePoint & RZone also provides you with a list of all values of this indicator for any group of stocks. This will allow you to compare the readings of this indicator across different stocks.
This indicator is also available in the System Builder of RZone & TradePoint for all charting methods. Using the system builder, you can develop various strategies based on the different conditions already present in this indicator. Additionally, it can be used with other indicators or price patterns to develop effective trading strategies. For any group of stocks and market segments, you can scan and backtest stocks based on those strategies.
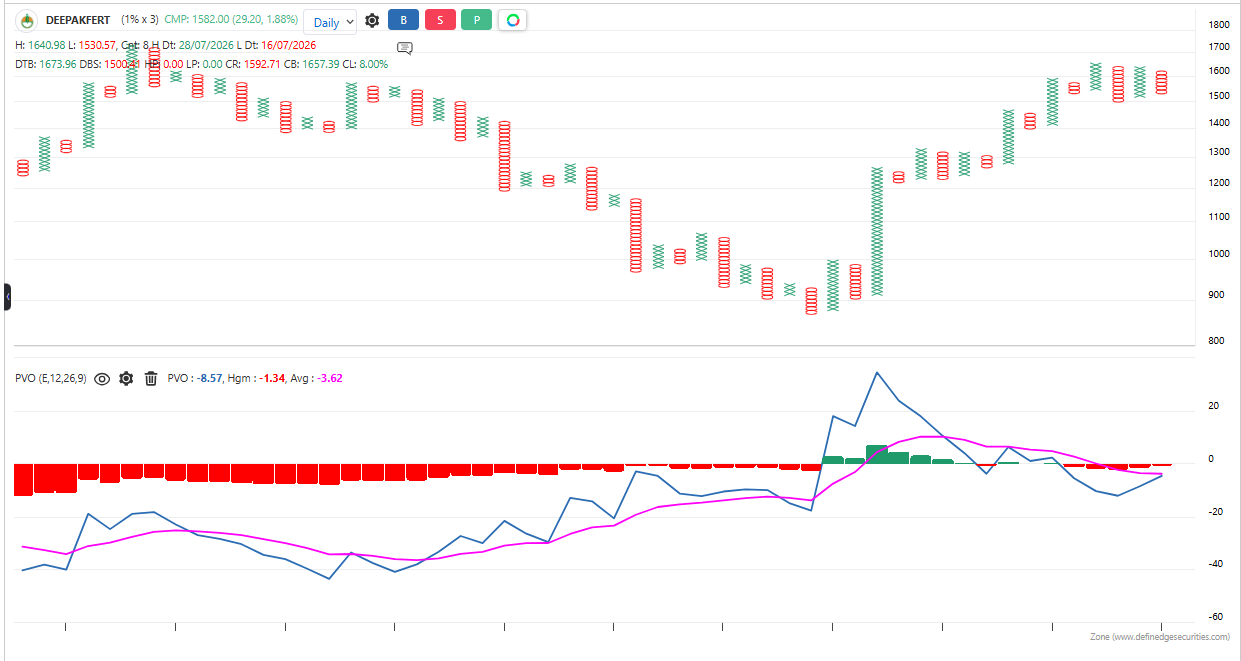
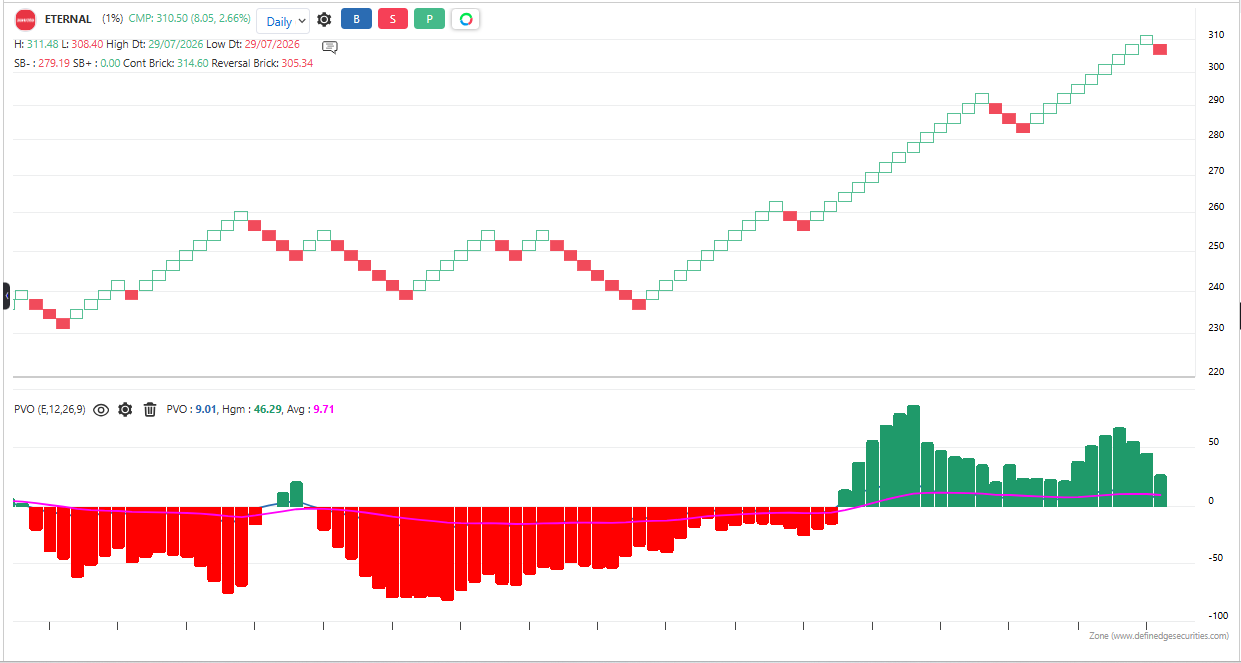
The indicator is applicable to all types of charting. Calculated based on the number of columns on P&F charts, bricks on Renko charts, lines on Line-break charts, candles on Heikin ashi charts, and lines on Kagi charts. While the formula and reading of the indicators remain the same, they become more dynamic on these charts.