Customer Support : 020-61923200, [email protected] | Call and Trade : 020-61923220

ATR Rank Indicator
#volatility #breakout #regimefilter
ATR Creator: J. Welles Wilder
Concept: Definedge
Locates today’s ATR between the minimum and maximum ATR of the lookback window: (ATR − Min) / (Max − Min) × 100. Where Percentile counts days, Rank measures stretch — how close volatility sits to the extremes of its recent range.
- Default ATR period: 14
- Default Rank Perdiod: 240
- Default Rank average: 50
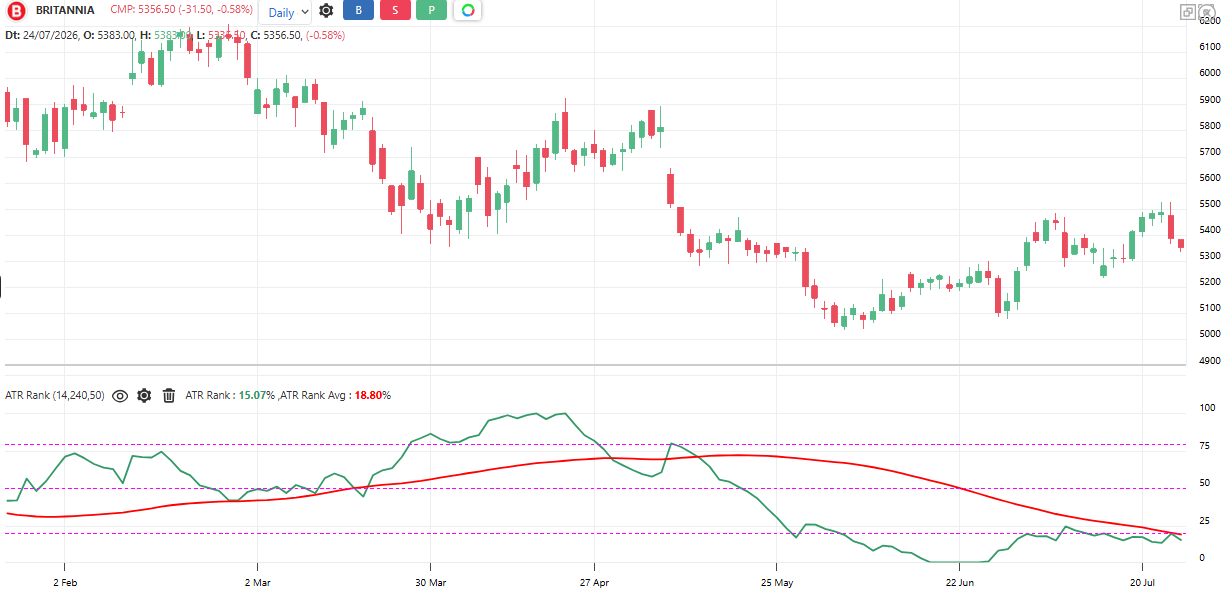
There are two lines plotted below the chart in the ATR Rank indicator.
- Green line is ATR Rank
- Red line is ATR Rank Average
The ATR Rank indicator measures volatility in the stock.
Rank near 0 indicates volatility at the low of its range. Rank near 100 indicates volatility at the high of its range.
The red line represents the average rank of the ATR over the last 240 periods. The ATR for the last 14 periods is indicated by the green line.
A scrip with a green line (current ATR percentile) above the red line (average percentile) is considered to be volatile, and vice versa, if the green line is below the red line, it is considered to be low.
Objective rules:
- Compression entry: Rank < 10 for 3+ bars, enter on price breakout with stop = 1.5× ATR
- Extension caution: Avoid fresh entries when Rank > 90 (stops too wide, R:R degraded)
- Divergence check: If Rank > 80 while Percentile < 60, inspect the window for a single spike before acting
What makes it unique:
It is the most sensitive of the volatility gauges — because min and max define its endpoints, it reaches its extremes earlier than percentile-based measures, making it the best early-warning of the group (at the cost of more false alarms).
The indicator table value in TradePoint & RZone also provides you with a list of all values of this indicator for any group of stocks. This will allow you to compare the readings of this indicator across different stocks.
This indicator is available in the System Builder on RZone & TradePoint for all charting methods. Using the system builder, you can develop various strategies based on the different conditions already present in this indicator. Additionally, it can be used with other indicators or price patterns to develop effective trading strategies. For any group of stocks and market segments, you can scan and backtest stocks based on those strategies.
The indicator is applicable to all types of charting. It is calculated based on the number of columns on P&F charts, bricks on Renko charts, lines on Line-break charts, candles on Heikin-Ashi charts, and lines on Kagi charts. While the formula and reading of the indicators remain the same, they become more dynamic on these charts.