Customer Support : 020-61923200, [email protected] | Call and Trade : 020-61923220

Chande Kroll Stop Indicator
#volatility #stoploss #trendfollowing
Inventor: Tushar Chande and Stanley Kroll
The Chande Kroll Stop is a stop-loss indicator designed to assist traders in determining optimal exit points by assessing the strength of price trends. Developed by Tushar Chande and Stanley Kroll, this indicator is built on the premise that market trends can be gauged by observing price volatility.
It adjusts stop-loss levels based on the volatility of the asset being traded. This dynamic adjustment helps protect gains while allowing for flexibility during periods of high volatility.
Key Components
-
Price Movement – The Chande Kroll Stop uses price movement to determine stop-loss levels with an attempt to predict the level where price reversal will likely occur.
-
Volatility – The indicator uses volatility to dynamically adjust the stop-loss level to the level of market uncertainty or price fluctuations. It uses the Average True Range (ATR) to account for market volatility.
-
Trend Following – The indicator aligns stop-loss levels with prevailing market trends. As the price moves in favor of the trend, the stop-loss level is adjusted to lock in profits. Conversely, when a price moves against the trend, the stop is triggered to minimize potential losses.
Advantages
-
Dynamic Adjustment: The Chande Kroll Stop adapts to changing market conditions adjusting the stop level as volatility changes, preventing premature stop-outs during volatile periods.
-
Risk Management: This indicator offers improved risk management compared to static stop-loss orders. It uses volatility to avoid tight stops during high volatility and ensures the stops are not too loose during low volatility. By adapting to market conditions, it optimizes risk-reward ratios for traders.
-
Flexibility: This indicator can be customized for various markets and timeframes, including stocks, commodities, and forex, making it versatile for different asset classes.
-
Trend Following: The Chande Kroll Stop is particularly beneficial for trend-following traders as it constantly adjusts the stop based on price action and volatility. It allows them to ride trends while ensuring they don’t get stopped out during normal market fluctuations.
Limitations
-
False Signals: The indicator may generate false signals in choppy or sideways markets, as it is specifically designed for trending markets. In sideways markets, the stop it may lead to frequent triggering of stop level leading to small losses or whipsaws.
-
Dependence on ATR: The reliance on the Average True Range for volatility measurement can lead to inaccuracies during extreme market events or rapid changes in volatility. This may lead to the stop-loss being set too wide or too narrow.
Who Should Use the Chande Kroll Stop?
-
Trend Traders: Traders who focus on identifying and riding trends can use this indicator to protect profits and minimize risk as trends develop.
-
Swing Traders: Traders who hold positions for several days or weeks can benefit from this tool, as it adjusts dynamically with price fluctuations and helps lock in profits as the trend progresses.
-
Volatility-Based Traders: Traders that monitor market volatility and prefer using volatility-adjusted stops can also use this indicator as it aligns well with that trading style
Useful readings:
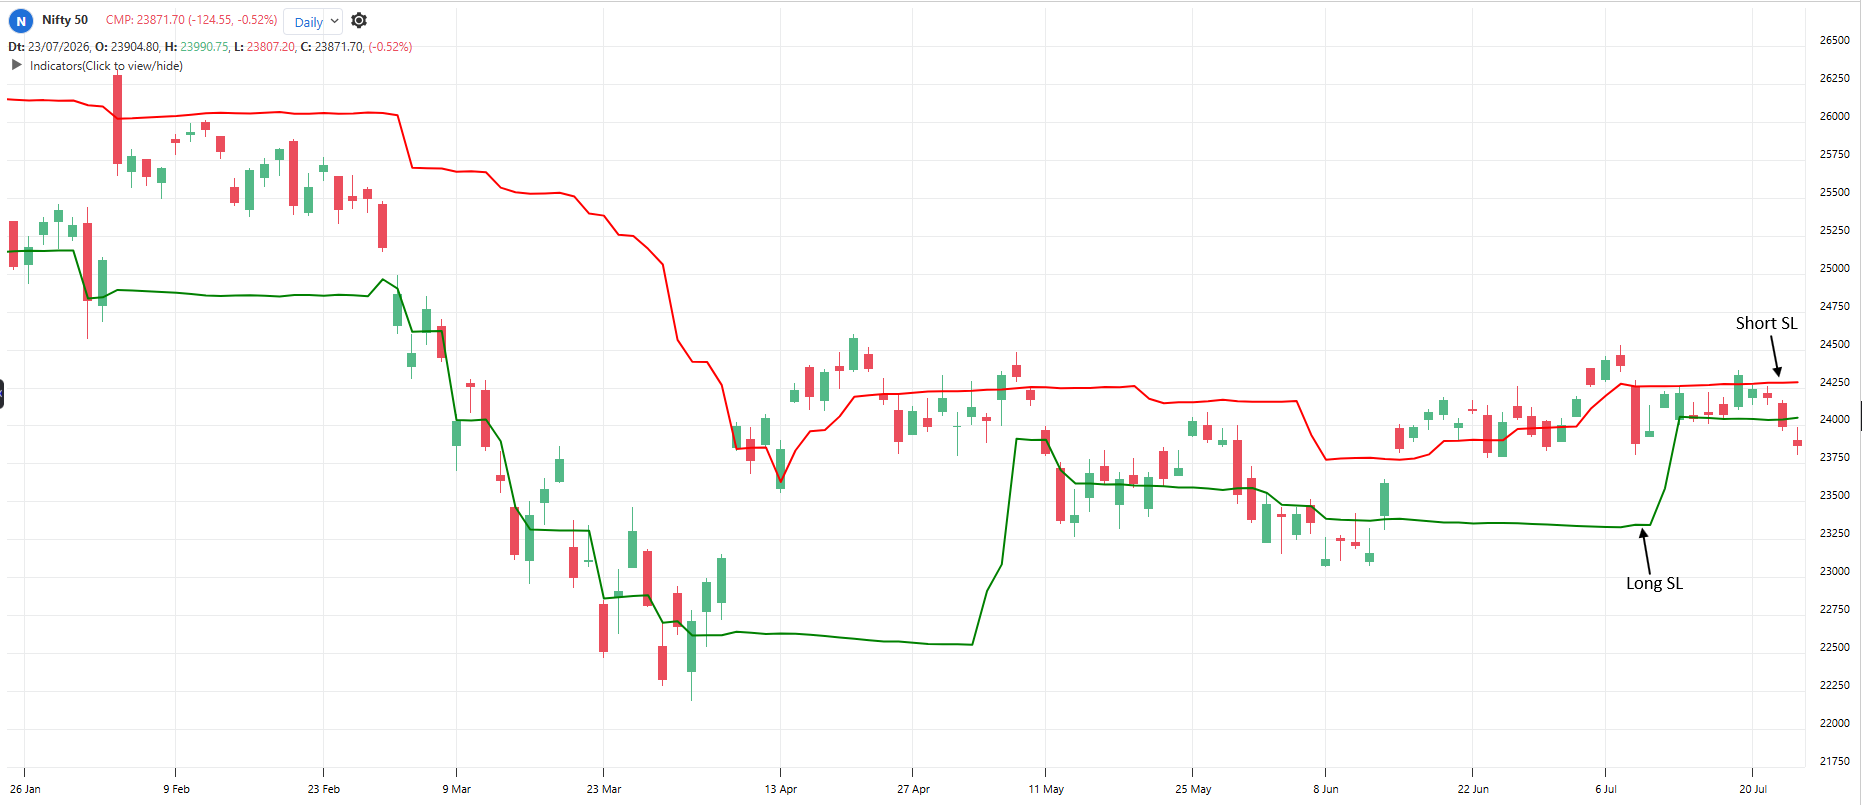
Price riding above both lines: Clean uptrend, trail longs on the lower line
Price riding below both lines: Clean downtrend, trail shorts on the upper line
Price stuck between the two lines: Neutral zone, avoid fresh trades
Lower line rising steadily: Uptrend healthy
Lines close together: Quiet market, tight stops, whipsaw risk
Lines far apart: Volatile market, cut position size
Objective rules:
Bullish: Price closes above the upper stop line.
Bearish: Price closes below the lower stop line.
Long trailing stop: Exit long when price closes below the lower line
Short trailing stop: Exit short when price closes above the upper line
Neutral filter: No fresh entries while price is between the two lines
What makes it unique:
It anchors stops to recent extremes rather than closes, then smooths them, creating a neutral no-trade zone between the lines. That built-in dead zone is unique among ATR stops.
The Chande Kroll Stop is a valuable tool for traders seeking a dynamic and adaptable approach to managing their stop-loss levels. By accounting for volatility and aligning with market trends, it helps traders protect their capital while maximizing profit potential.
You can find this indicator in the Study Menu in the TradePoint Desktop Terminal. By combining this pattern with other patterns and indicators, you can create your own trading strategies. For any group of stocks and market segments, you can scan and backtest stocks based on those strategies.
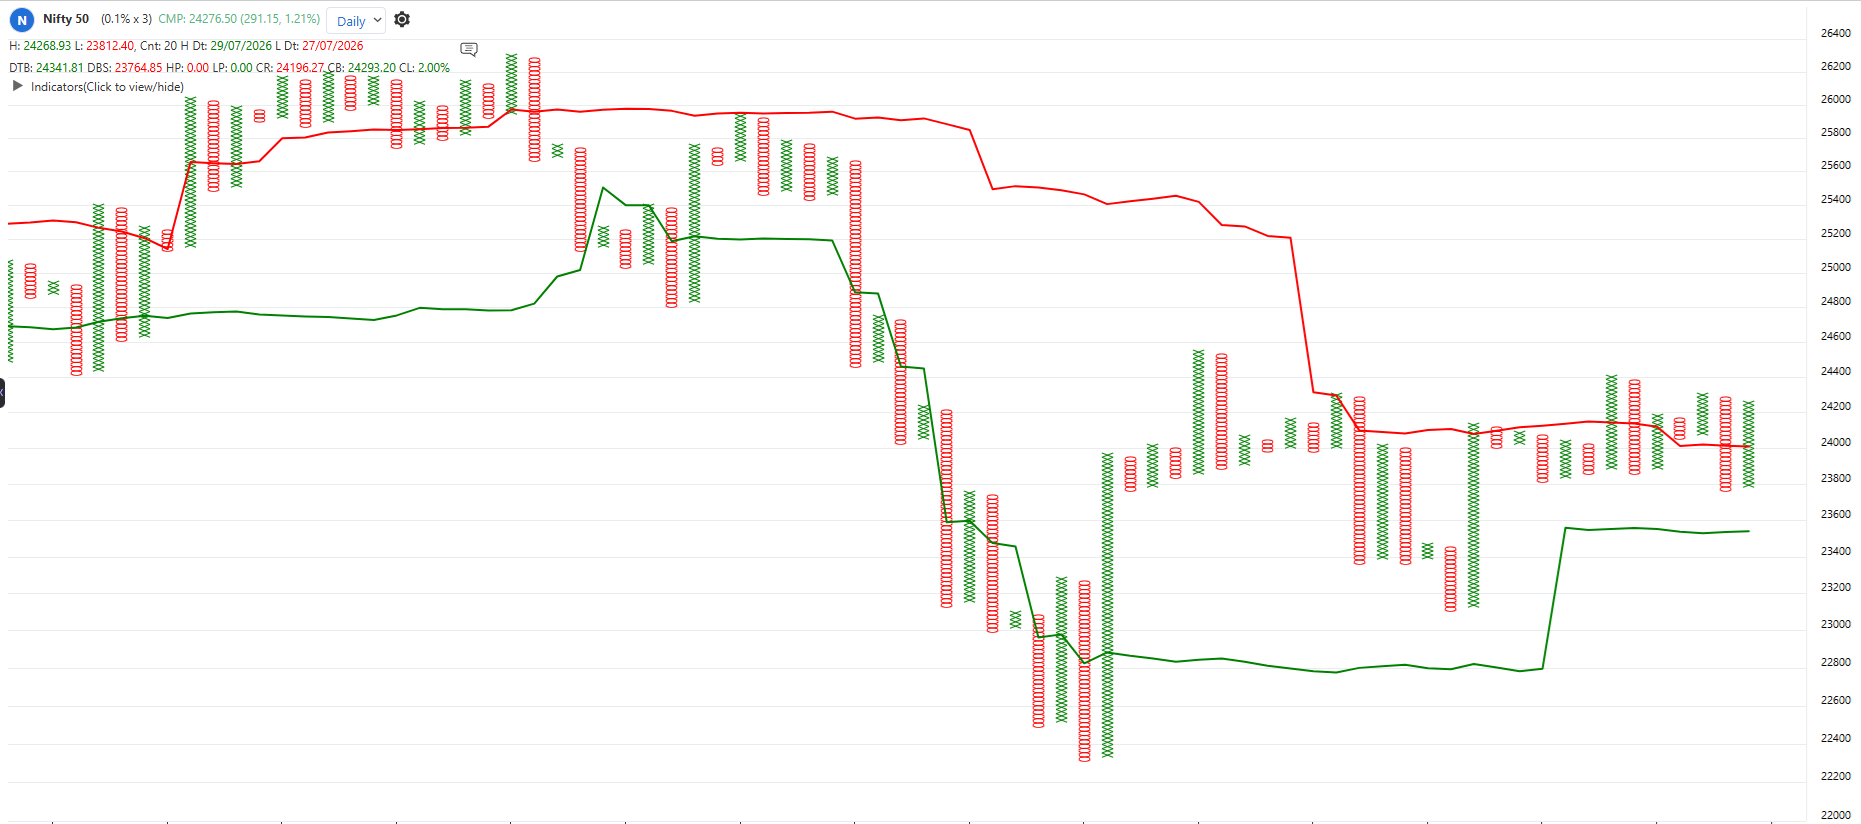
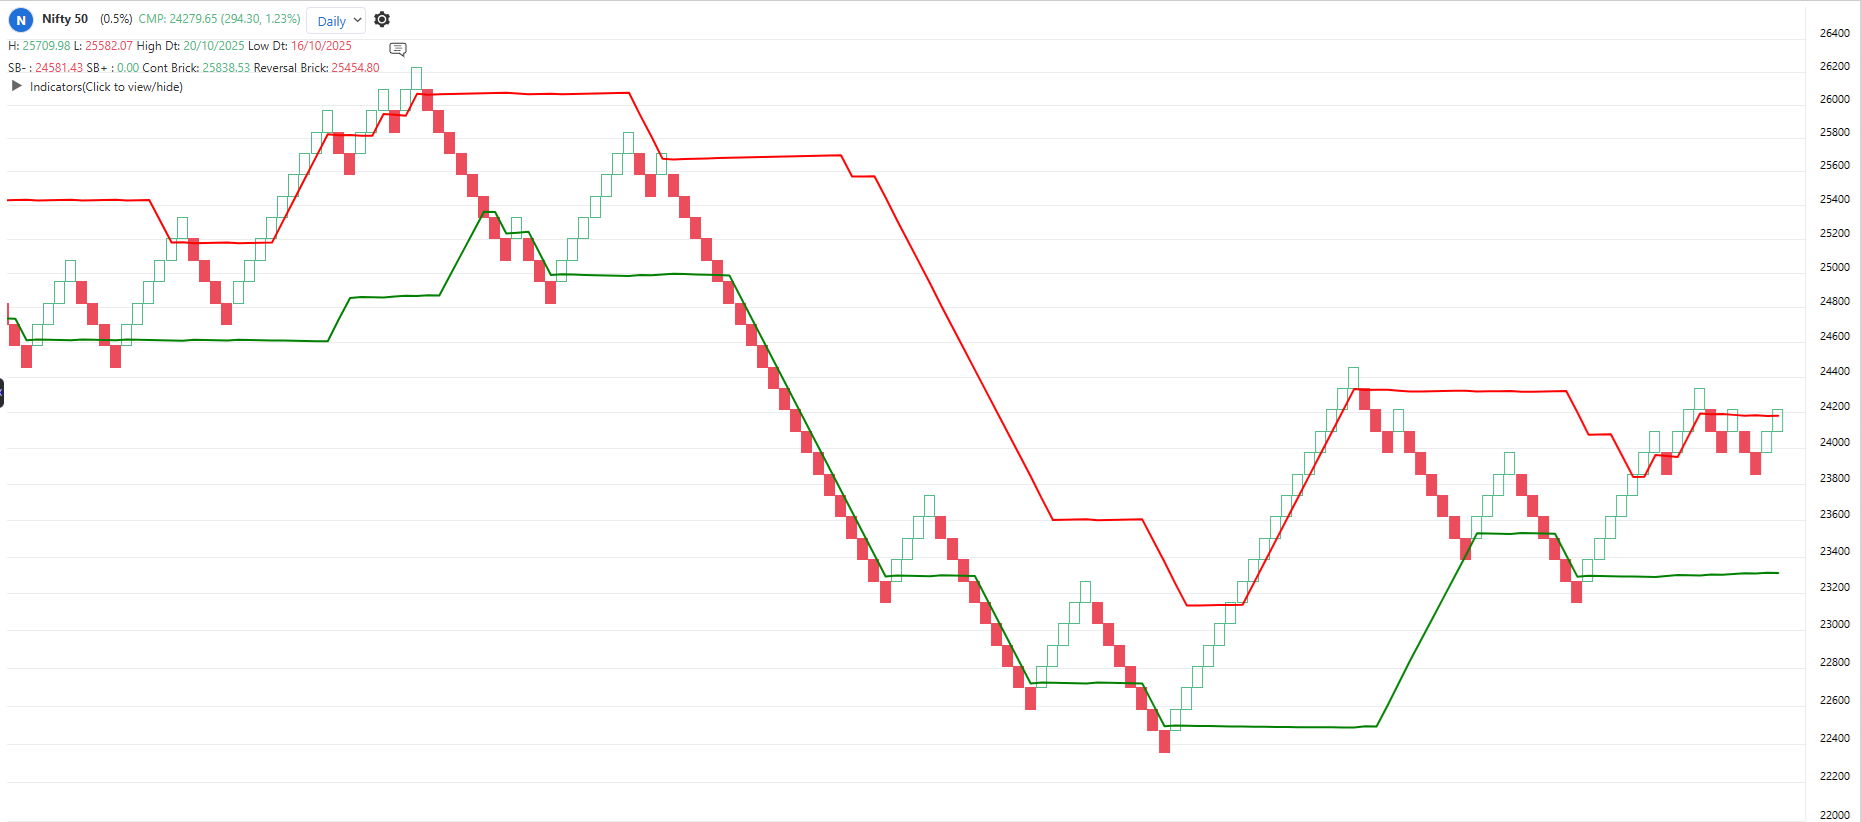
The indicator is applicable to all types of charting. It is calculated based on the number of columns on P&F charts, bricks on Renko charts, lines on Line-break charts, candles on Heikin-Ashi charts, and lines on Kagi charts. While the formula and reading of the indicators remain the same, they become more dynamic on these charts.