Customer Support : 020-61923200, [email protected] | Call and Trade : 020-61923220

D Momentum Pullback Indicator
#momentum #pullback #scoring #multi-criteria
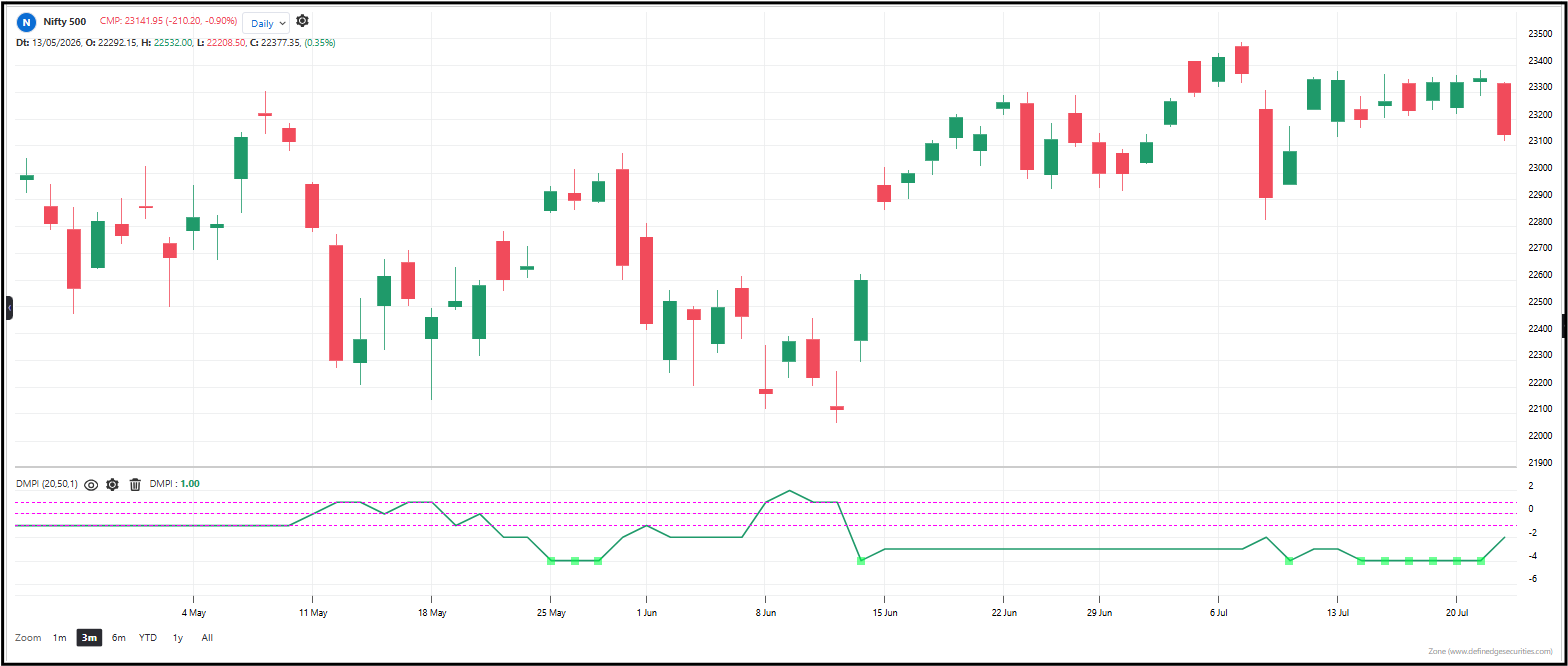
This indicator scores the current market condition across four different dimensions momentum, pullback magnitude, price position, and trend alignment then adds them up into a single number between -4 and +4. A reading of -4 means all four conditions align for a bullish pullback setup. A reading of +4 means all four align for a bearish pullback. Anything in between is a mixed signal.
Default period: 10 days / 20 days
Line behavior: Moves in discrete steps between -4 and +4. Green dots mark -4 readings; red dots mark +4 readings.
Useful readings: Wait for the extreme readings. A green dot at -4 is a high-probability bullish entry signal. A red dot at +4 is a high-probability bearish entry signal. The further the reading is from zero, the stronger the alignment.
Objective rules:
– MPI at -4 (green dot) = strong bullish pullback, all conditions aligned
– MPI at +4 (red dot) = strong bearish pullback, all conditions aligned
– MPI moving toward -4 = conditions improving for bulls
– MPI moving toward +4 = conditions improving for bears
The indicator table value in TradePoint & RZone also provides you with a list of all values of this indicator for any group of stocks. This will allow you to compare the readings of this indicator across different stocks.
The indicator is applicable to all types of charting. Calculated based on the number of columns on P&F charts, bricks on Renko charts, lines on Line-break charts, candles on Heikin ashi charts, and lines on Kagi charts. While the formula and reading of the indicators remain the same, they become more dynamic on these charts.
This indicator is also available in the System Builder of RZone & TradePoint for all charting methods. Using the system builder, you can develop various strategies based on the different conditions already present in this indicator. Additionally, it can be used with other indicators or price patterns to develop effective trading strategies. For any group of stocks and market segments, you can scan and backtest stocks based on those strategies.