Customer Support : 020-61923200, [email protected] | Call and Trade : 020-61923220

Ichimoku
#trendfollowing #system
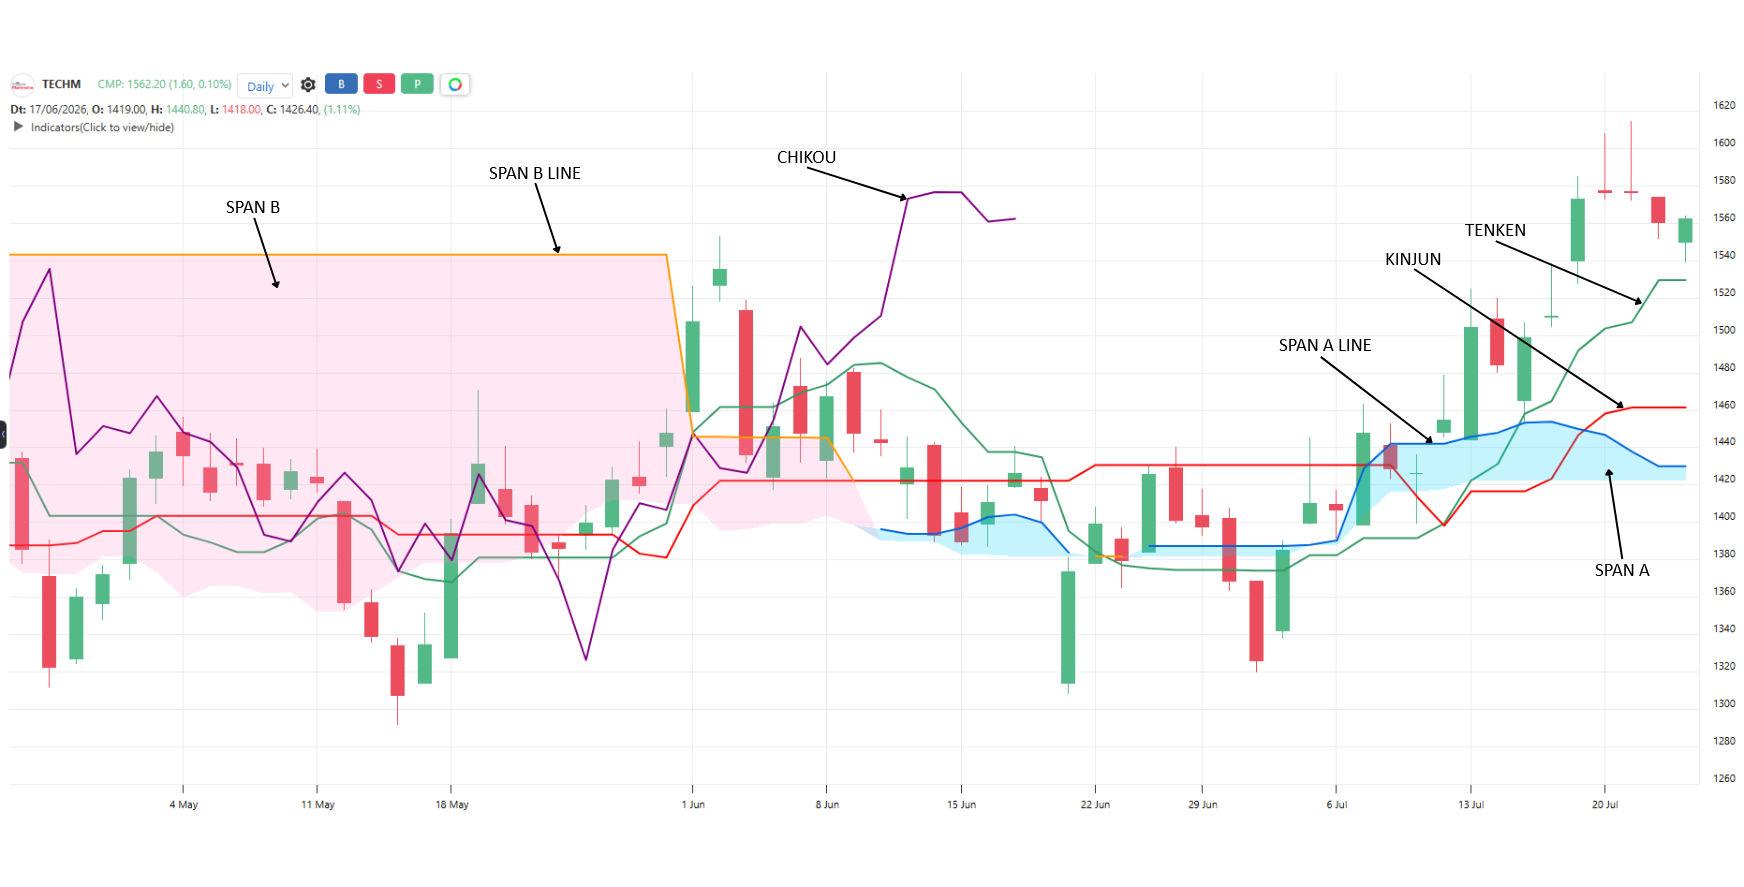
Inventor: Goichi Hosoda
- Tenken period: 9
- Kinjun period: 26
- Chikou period: 26
- Senkou Span A: 52
- Senkou Span B: 26
Ichimoku is a popular Japanese indicator.
A cloud is formed by Span A and Span B lines. A price above the Ichimoku cloud is bullish, and a price below the Ichimoku cloud is bearish.
If the Tenken line is above the Kinjun line and the price is about the cloud, it is very bullish. It is highly bearish when the price is below the cloud and the Tenken line is below the Kinjun line.
Useful readings:
Price above Cloud: Bulls in control, look for longs only
Price below Cloud: Bears in control, look for shorts only
Price inside Cloud: Battle zone, avoid fresh trades
Tenken crosses above Kinjun: Momentum turning up (stronger if above the Cloud)
Thick Cloud ahead: Strong support/resistance zone coming
Thin Cloud ahead: Weak zone, easy for price to cross
Cloud changing color ahead: Trend change forming in advance
Objective rules:
Bullish: Price closes above the Cloud AND Tenken is above Kinjun.
Bearish: Price closes below the Cloud AND Tenken is below Kinjun.
Strong bullish setup: Price above Cloud AND Tenken above Kinjun AND Chikou above old candles
Strong bearish setup: Price below Cloud AND Tenken below Kinjun AND Chikou below old candles
Long exit: Price closes below Kinjun
Short exit: Price closes above Kinjun
No-trade filter: Skip signals while price is inside the Cloud
What makes it unique:
It is a complete trading system – trend, momentum, support, resistance and confirmation – drawn in one indicator. Its Cloud projects support and resistance into the future, which almost nothing else does.
Click here to learn more about the indicator.
The indicator can be found in the Indicator Digger section of TradePoint & RZone. There are ready conditions in tabular format that can be used to pick stocks based on the condition of this indicator on any charting technique.
The indicator table value in TradePoint & RZone also provides you with a list of all values of this indicator for any group of stocks. This will allow you to compare the readings of this indicator across different stocks.
This indicator is also available in the System Builder on RZone & TradePoint for all charting methods. Using the system builder, you can develop various strategies based on the different conditions already present in this indicator. Additionally, it can be used with other indicators or price patterns to develop effective trading strategies. For any group of stocks and market segments, you can scan and backtest stocks based on those strategies.
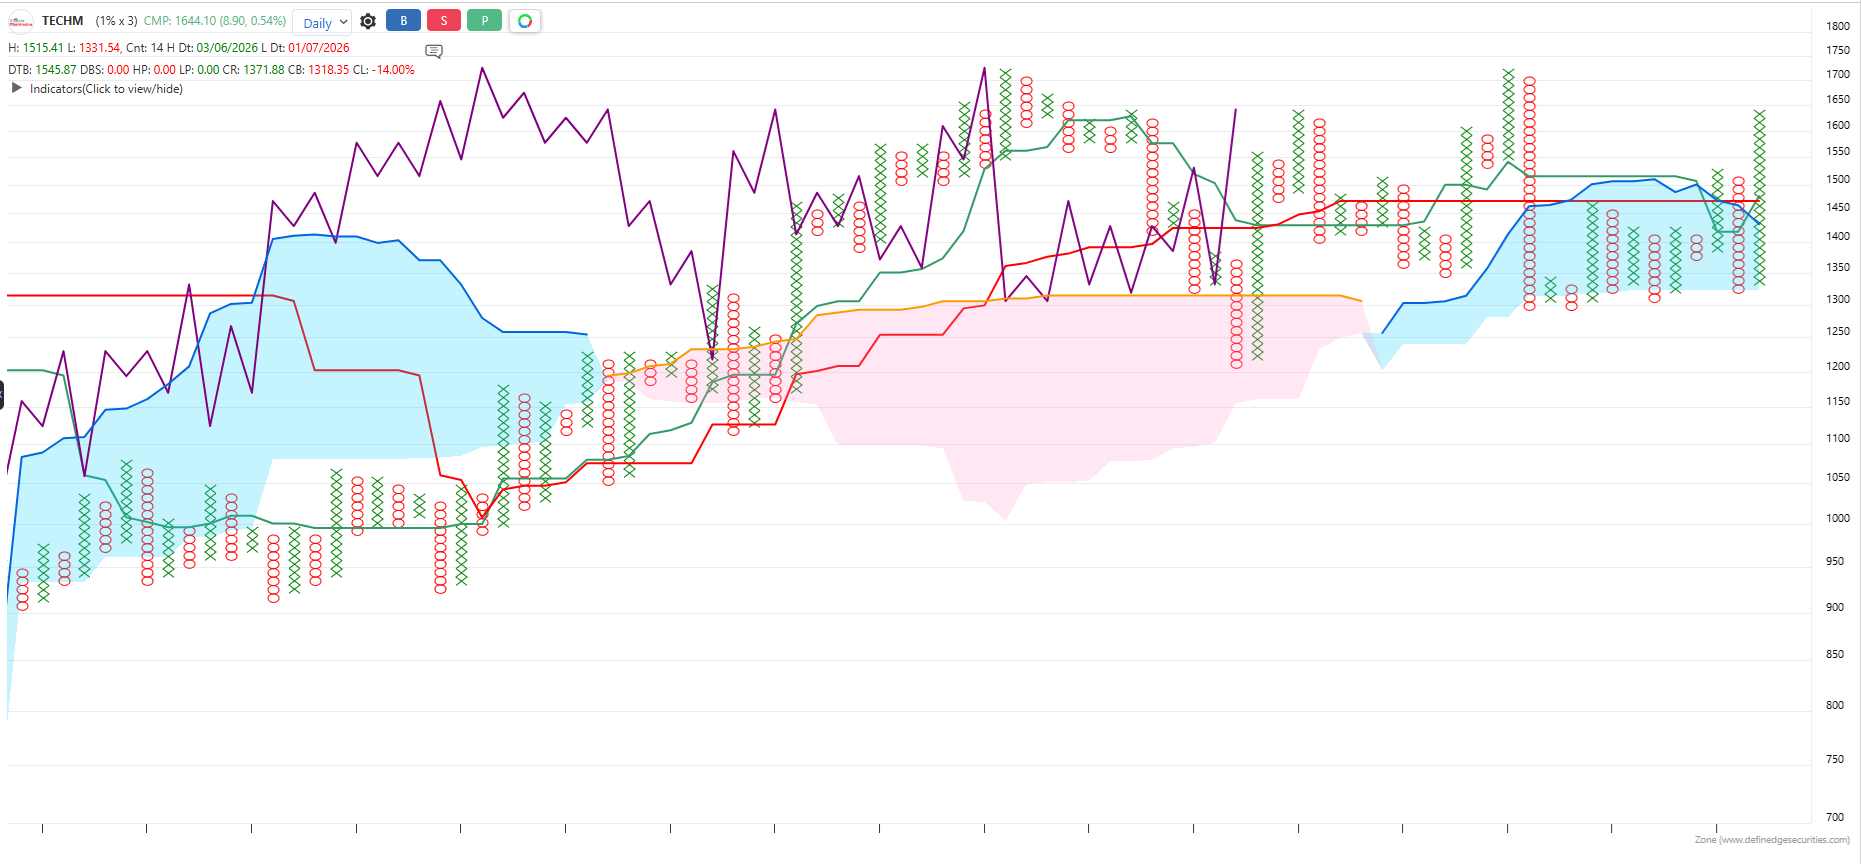
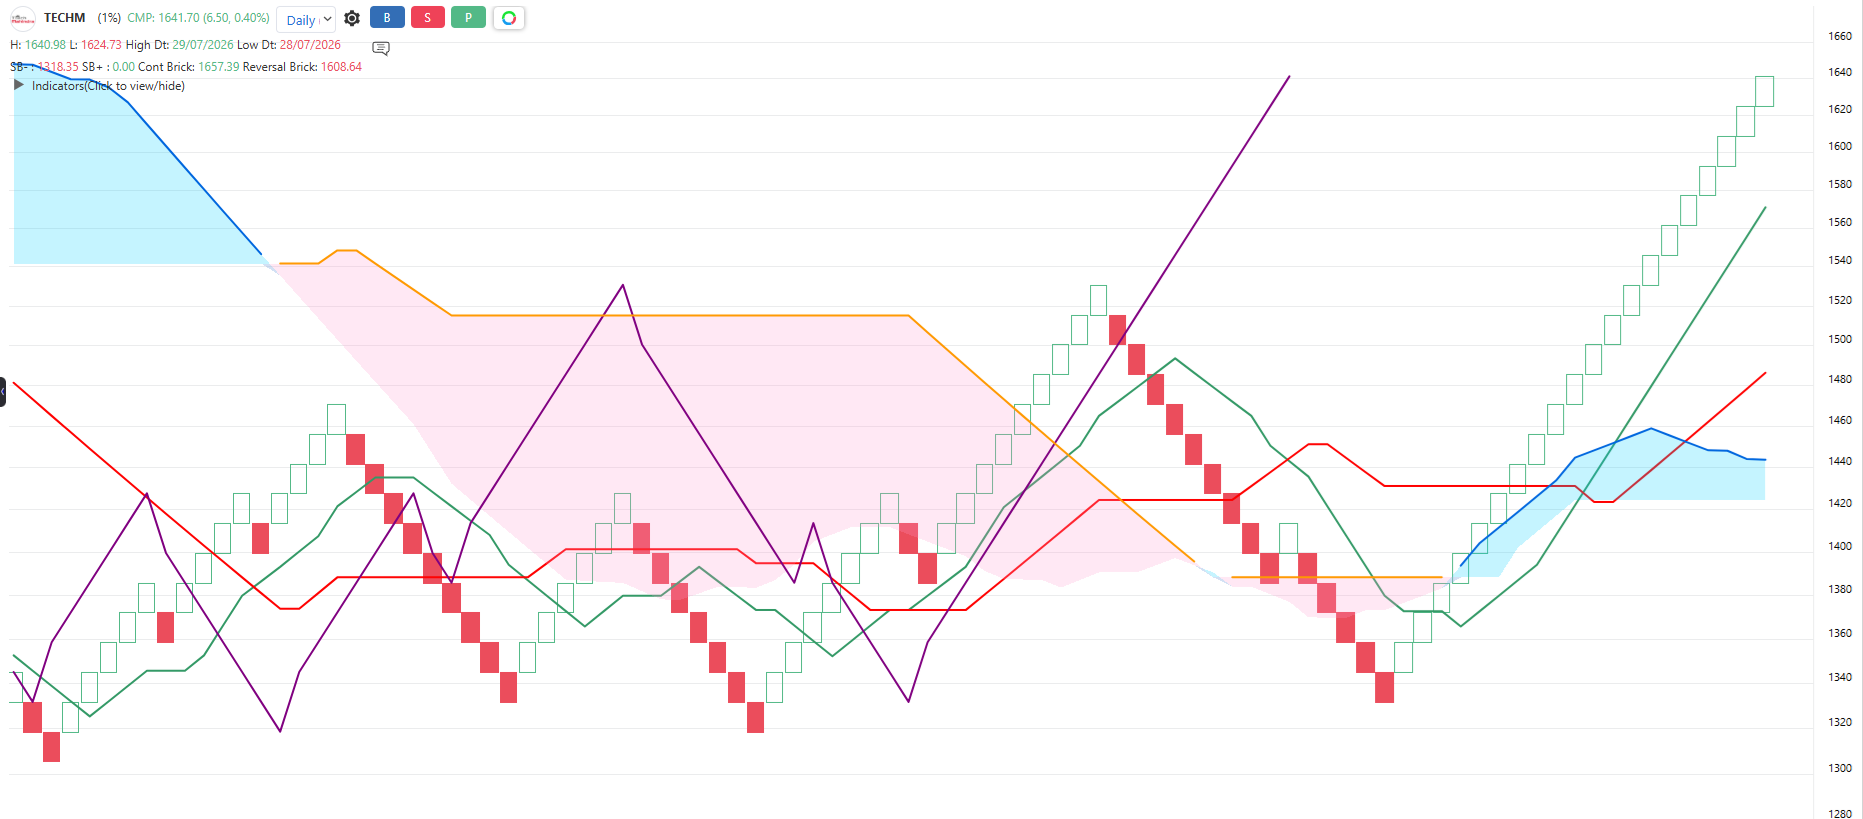
The indicator is applicable to all types of charting. It is calculated based on the number of columns on P&F charts, bricks on Renko charts, lines on Line-break charts, candles on Heikin-Ashi charts, and lines on Kagi charts. While the formula and reading of the indicators remain the same, they become more dynamic on these charts.