Customer Support : 020-61923200, [email protected] | Call and Trade : 020-61923220
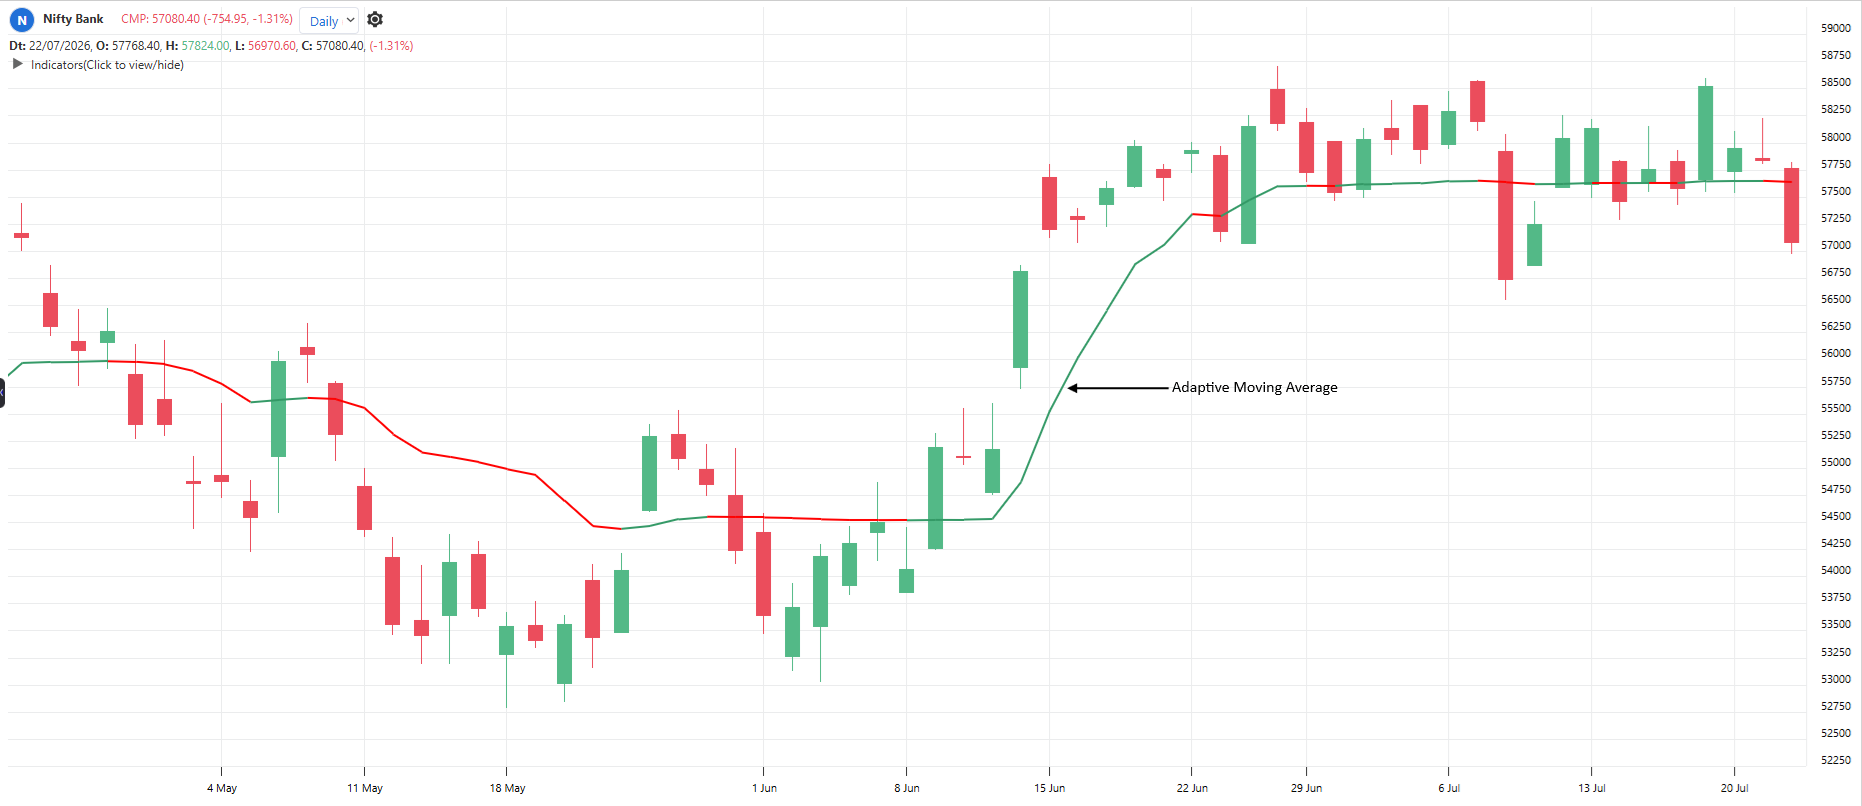
Adaptive Moving Average
#trendfollowing #movingaverage #adaptive
Inventor: Perry Kaufman
A moving average that changes its own speed. It moves fast when price is trending smoothly and slows down when price is choppy. So it hugs trends closely but stays flat in sideways markets, giving fewer false crossovers than a normal moving average.
Default period: 10
Rising KAMA indicates uptrend. Falling KAMA indicates downtrend. Flat KAMA indicates no trend.
Useful readings:
Price above rising KAMA: Uptrend in progress
Price below falling KAMA: Downtrend in progress
KAMA goes flat: Market turning sideways, avoid fresh trend trades
Price crosses a flat KAMA again and again: Choppy market, ignore crossovers
KAMA slope getting steeper: Trend picking up speed
Objective rules:
Bullish: Price closes above KAMA and KAMA is rising.
Bearish: Price closes below KAMA and KAMA is falling.
Flat filter: Skip signals if KAMA has moved less than 1% in the last 10 bars
Long exit: Price closes below KAMA
Short exit: Price closes above KAMA
What makes it unique:
It is the only mainstream moving average that changes its own speed bar by bar based on how efficiently price is moving. In chop it nearly stops moving, silencing the false crossovers that plague fixed averages.
The indicator table value in TradePoint & RZone also provides you with a list of all values of this indicator for any group of stocks. This will allow you to compare the readings of this indicator across different stocks.
This indicator is available in the System Builder on RZone & TradePoint for all charting methods. Using the system builder, you can develop various strategies based on the different conditions already present in this indicator. Additionally, it can be used with other indicators or price patterns to develop effective trading strategies. For any group of stocks and market segments, you can scan and backtest stocks based on those strategies.
Click here to learn more about the indicator.
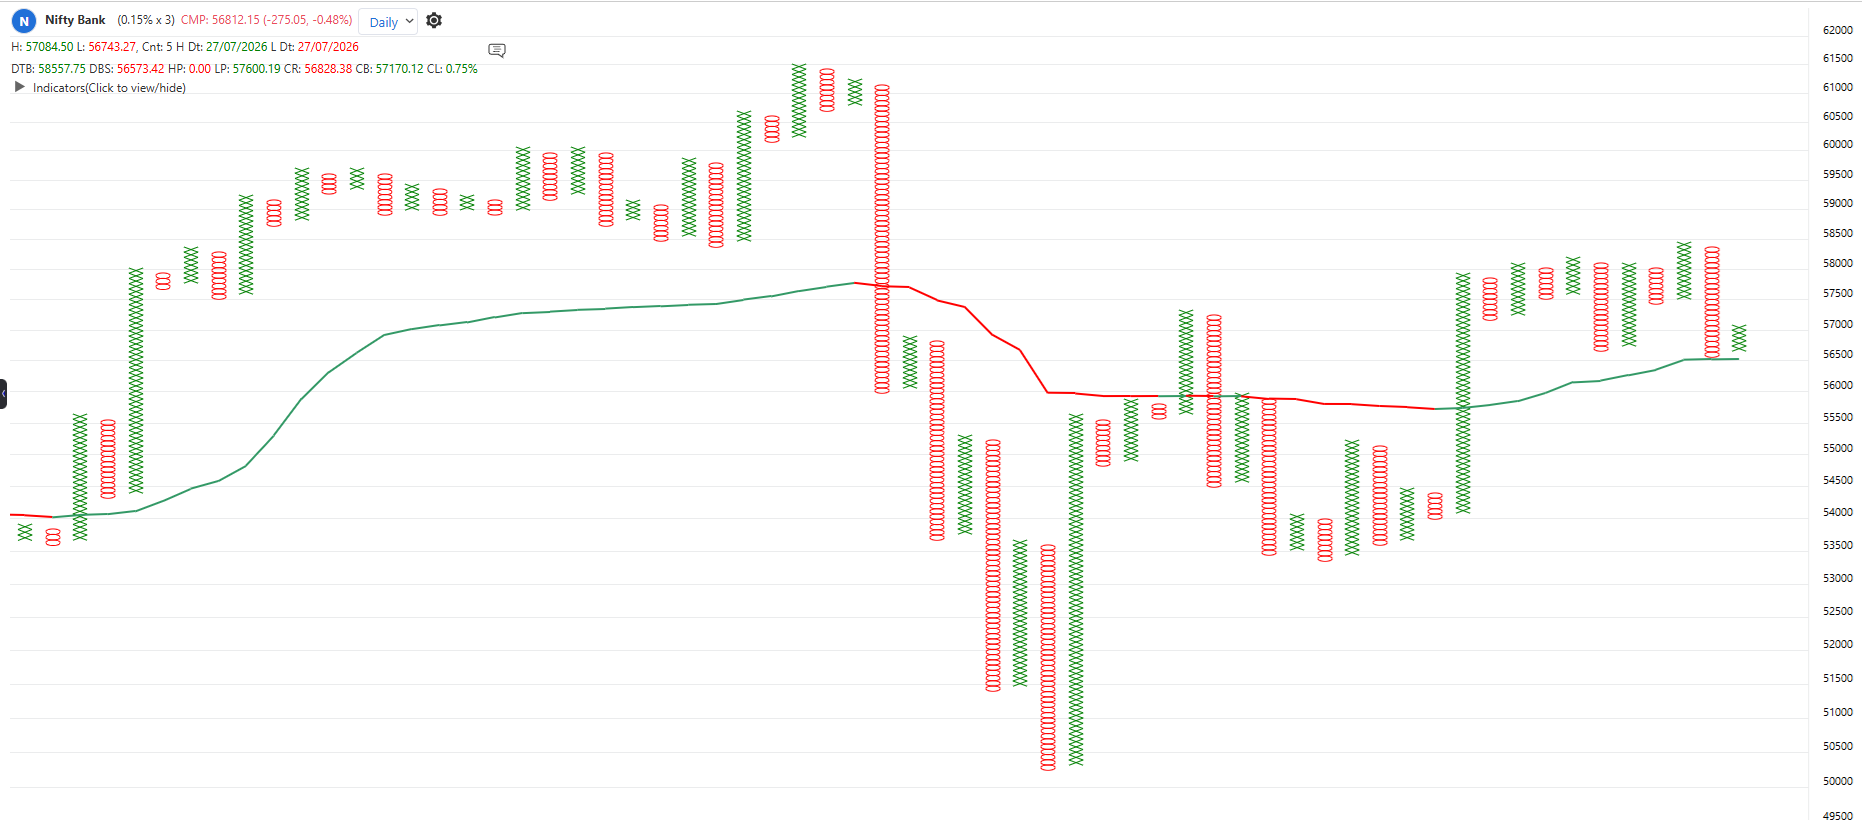
Default period: 10
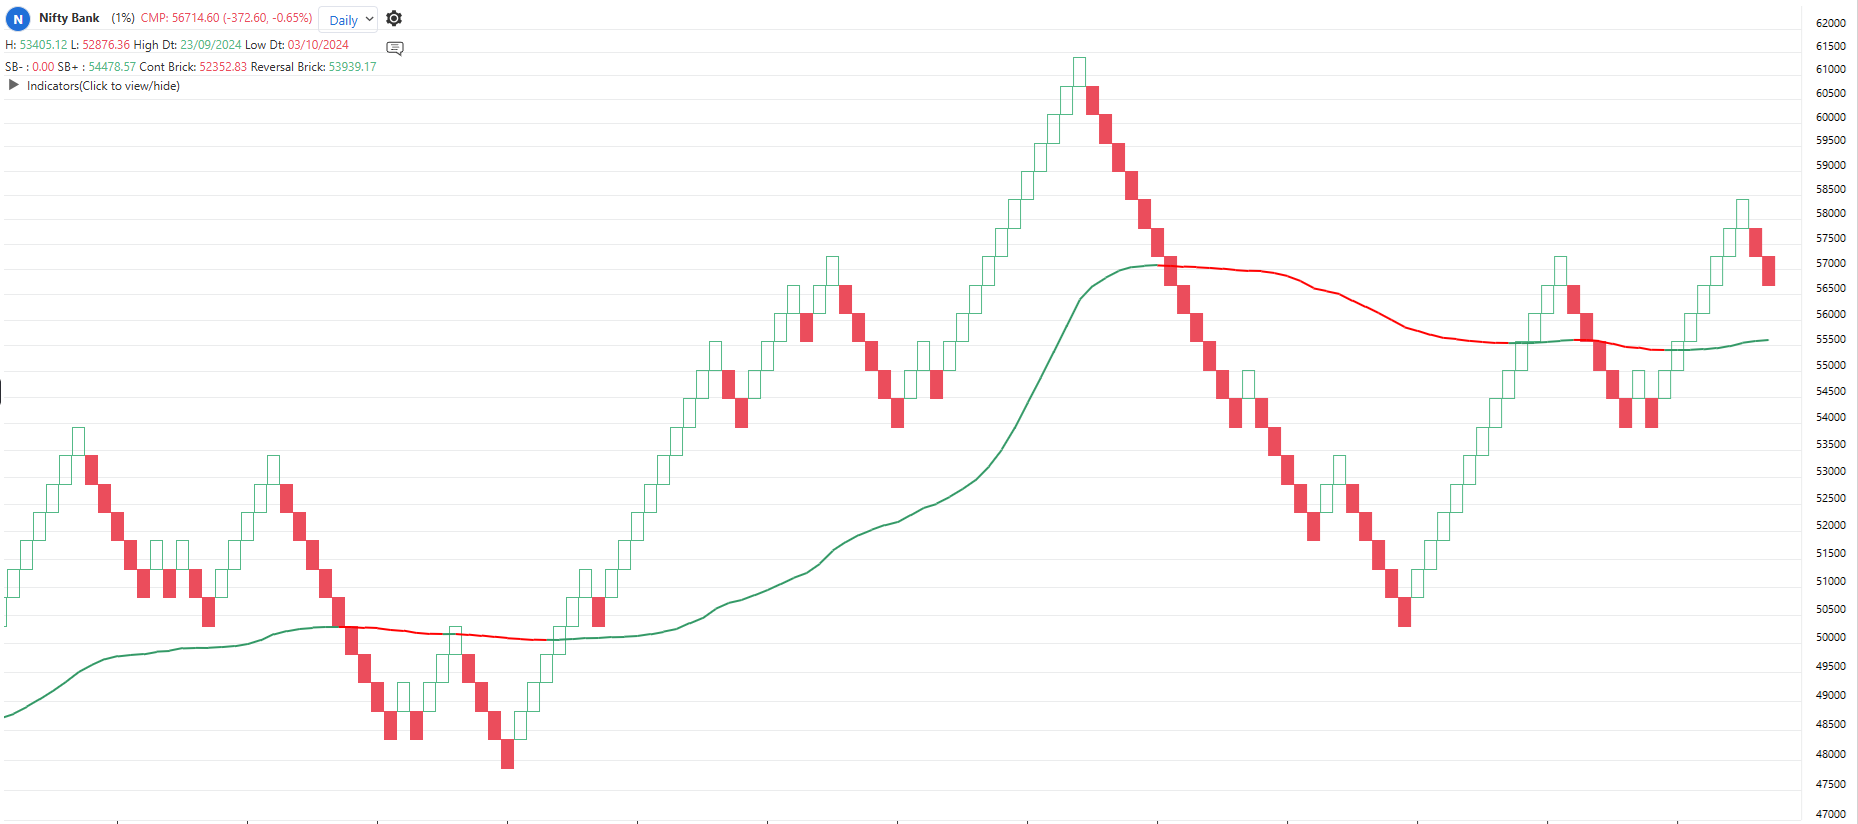
Default period: 40
The indicator is applicable to all types of charting. It is calculated based on the number of columns on P&F charts, bricks on Renko charts, lines on Line-break charts, candles on Heikin-Ashi charts, and lines on Kagi charts. While the formula and interpretation of the indicators remain the same, they become more dynamic on these charts.